Research Article - Onkologia i Radioterapia ( 2026) Volume 20, Issue 1
Dosimetric Impact of Systematic Hounsfield Units Shifts on Prostate VMAT Treatment Planning
Imane Hattal1,2*, A. Rrhioua1, A. El Outmani1,3, M. Zerfaoui1, D. Bakari4 and Y. Oulhouq12Centre Oriental Al Kindy, Oncologie et diagnostic du Maroc (ODM), Oujda, Morocco
3Clinique Spécialisée Ménara, Oncologie et diagnostic du Maroc (ODM), Marrakech, Morocco
4National School of Applied Sciences, Mohammed First University, Oujda, Morocco
Imane Hattal, Mohammed First University, Faculty of Sciences, LPTPME, 60000, Oujda, Morocco, Email: imanehattal@gmail.com
Received: 01-Jan-2026, Manuscript No. OAR-26-184025; , Pre QC No. OAR-26-184025 (PQ); Editor assigned: 05-Jan-2026, Pre QC No. OAR-26-184025 (PQ); Reviewed: 21-Jan-2026, QC No. OAR-26-184025 ; Revised: 26-Jan-2026, Manuscript No. OAR-26-184025 (R); Published: 31-Jan-2026
Abstract
Background: Accurate conversion of computed tomography (CT) Hounsfield Units (HU) into relative electron density (RED) is fundamental for precise dose calculation in external beam radiotherapy. Variations in the HU-RED calibration curve, arising from scanner drift, acquisition parameters, or reconstruction algorithms, may introduce dosimetric uncertainties that could affect treatment outcomes.
Purpose: This study aimed to systematically evaluate the dosimetric impact of HU calibration variations on volumetric modulated arc therapy (VMAT) treatment plans for prostate cancer, focusing on target coverage and organs at risk (OARs) sparing.
Methods: A reference HU-RED calibration curve was established using a CIRS Model 062M electron density phantom scanned with a Philips Brilliance Big Bore CT scanner. Two modified curves were generated by applying systematic shifts of +50 HU and +200 HU. Ten patients with localized prostate cancer, treated with VMAT (78 Gy in 39 fractions), were retrospectively selected. Three treatment plans were generated per patient using each calibration curve. Dosimetric parameters including Dmax, Dmin, Dmean, conformity index (CI), and homogeneity index (HI) for the planning target volume (PTV), along with dose-volume metrics for bladder, rectum, and femoral heads, were compared using the Wilcoxon signed-rank test.
Results: The +50 HU shift produced minimal dosimetric changes (<0.5% for PTV Dmean) without statistical significance (p>0.05). In contrast, the +200 HU shift resulted in statistically significant reductions in PTV Dmax (1.55%, p=0.037) and Dmean (1.26%, p=0.043), along with significant deterioration in CI (6.89% increase, p=0.008). The bladder showed the highest sensitivity with V25Gy variations up to 38.15% (p=0.005), while rectal parameters remained stable across all curves (p>0.05).
Conclusion: HU variations within +50 HU maintain dosimetric accuracy within clinically acceptable thresholds. However, larger calibration errors (+200 HU) can produce significant dosimetric deviations, particularly for soft-tissue OARs. These findings emphasize the importance of rigorous CT calibration protocols and regular quality assurance to ensure treatment planning accuracy in prostate radiotherapy
Keywords
HU–RED conversion curve; Dose calculation; VMAT; Prostate cancer
INTRODUCTION
Computed tomography (CT) imaging serves as the cornerstone of modern radiotherapy treatment planning, providing both the anatomical framework for target and organs delineation and the electron density information essential for accurate dose calculation [1,2]. The relationship between CT Hounsfield Units (HU) and relative electron density (RED) forms the basis of photon beam dose computation in treatment planning systems (TPS), with the accuracy of this conversion directly impacting the reliability of calculated dose distributions [3,4].
The HU-RED relationship can be influenced by multiple factors including CT scanner characteristics, acquisition parameters (tube voltage, current, reconstruction kernel), patient-specific factors (body habitus, presence of contrast agents), and temporal variations in scanner calibration [5,6]. Studies have demonstrated that HU values for identical materials can vary by 20-100 HU across different scanners and protocols, potentially introducing systematic biases in dose calculation [7,8].
International guidelines, including recommendations from the American Association of Physicists in Medicine (AAPM) Task Group 66 and the International Atomic Energy Agency (IAEA), establish tolerance levels of ±20-40 HU for soft tissues and ±50-100 HU for bone and lung equivalents [9,10]. These tolerances are designed to maintain dose calculation accuracy within 1-2%, which is considered clinically acceptable for most treatment scenarios [11].
Prostate cancer radiotherapy represents a clinical scenario where dose accuracy is paramount. Modern treatment approaches, including volumetric modulated arc therapy (VMAT), deliver highly conformal dose distributions with steep dose gradients near critical structures such as the rectum and bladder [12,13]. In this context, even modest dosimetric uncertainties could potentially affect tumor control probability or normal tissue complication probability [14,15].
While several studies have investigated the general impact of Hounsfield unit (HU) uncertainties on dose calculation accuracy [16–18], relatively few have specifically examined the sensitivity of prostate VMAT treatment plans to systematic HU-RED calibration shifts. Recent studies have demonstrated that variations in HU-to-density conversion can lead to clinically relevant dose discrepancies under extreme or systematic conditions [19], and that dose sensitivity to calibration errors may vary across tissue types, with soft-tissue regions exhibiting greater susceptibility than high- or low-density structures such as bone or lung [20].
The aim of this study was to systematically quantify the dosimetric impact of HU-RED calibration variations on prostate VMAT treatment plans. Specifically, we evaluated how shifts of +50 HU (representing routine scanner variability) and +200 HU (representing significant calibration error) affect target coverage and OAR doses, with the goal of establishing evidence-based recommendations for CT calibration quality assurance in clinical practice.
Materials and Methods
Study Design and Patient Selection
Ten patients with localized prostate adenocarcinoma (T1c-T2c, Gleason score 6-7, PSA <20 ng/mL) who received definitive VMAT treatment at our institution between January 2022 and December 2023 were retrospectively selected to represent typical clinical scenarios. Patients were included if they had histologically confirmed prostate adenocarcinoma, underwent curative-intent VMAT treatment, had available original planning CT datasets, and had no history of prior pelvic radiotherapy or surgery.
CT Image Acquisition and HU-RED Calibration
All CT scans were acquired on a Philips Brilliance Big Bore scanner (Philips Healthcare, Best, The Netherlands) using a standardized pelvis protocol: tube voltage of 120 kVp, automatic tube current modulation (100-350 mA), 2.5 mm slice thickness, 500 mm field of view, and standard (B) reconstruction kernel. Patients were scanned in the supine position with a full bladder protocol and rectal preparation.
The reference HU-RED calibration curve was established using the CIRS Model 062M electron density phantom (Computerized Imaging Reference Systems, Inc., Norfolk, VA, USA). This phantom consists of two nested plastic disks containing 17 tissue-substitute materials spanning the range from lung-equivalent to dense bone (RED 0.190 to 1.695). The phantom was scanned using the identical clinical protocol, and circular regions of interest (ROI, 10 mm diameter) were placed on each insert to measure mean HU values. These measurements were correlated with manufacturer-specified RED values to generate the reference calibration curve, which was implemented in the TPS.
Generation of Modified Calibration Curves
Three HU-RED conversion curves were implemented for this study [Figure 1]:

Figure 1: Comparison of the three HU–RED calibration curves: the reference (+0 HU) and those derived from simulated HU shifts (+50 HU and +200 HU)
- CT +0: Standard calibration curve (reference curve) derived from phantom measurements, representing optimal scanner calibration.
- CT +50: Reference curve with systematic +50 HU offset, simulating routine scanner variability and minor calibration drift within typical quality assurance tolerances [9, 10].
- CT +200: Reference curve with systematic +200 HU offset, representing significant calibration error or failure of quality assurance protocols, providing an upper bound for potential dosimetric impact.
The +50 HU shift was selected based on AAPM TG-66 recommendations for acceptable HU variability (±40 HU for water-equivalent tissues), while the +200 HU shift represents a scenario of substantial calibration failure that would typically be detected by routine quality assurance but may occur in exceptional circumstances.
Treatment Planning
Target volumes and OARs were contoured according to RTOG consensus guidelines [21]. The clinical target volume (CTV) encompassed the prostate gland without seminal vesicles. The planning target volume (PTV) was generated by adding a 7 mm margin in all directions except posteriorly (5 mm) to account for setup uncertainty and organ motion. OARs included the bladder, rectum, and bilateral femoral heads. VMAT treatment plans were created using Eclipse Treatment Planning System version 15.6 (Varian Medical Systems, Palo Alto, CA, USA) with the Anisotropic Analytical Algorithm (AAA, version 15.6.0) for dose calculation and the Photon optimizer (PO, version 15.6.0) for the optimization phase. The prescription was 78 Gy in 39 fractions (2 Gy/fraction) delivered using two full coplanar arcs (clockwise and counter-clockwise) with 6 MV photon beams from a Vitalbeam linear accelerator (Varian Medical Systems). A dose calculation grid size of 2.5 mm was used. Planning objectives followed institutional protocols based on QUANTEC recommendations [22]: PTV D95% ≥ 95% of prescription (74.1 Gy), V107% < 5%; rectum V50Gy < 50%, V60Gy < 35%, V65Gy < 25%, V70Gy < 20%, V75Gy < 15%; bladder V65Gy < 50%, V70Gy < 35%, V75Gy < 25%, V80Gy < 15%; femoral heads Dmax < 50 Gy. For each patient, the clinically approved treatment plan optimized using the reference HU–RED calibration curve was re-optimized and recalculated separately using each of the two modified calibration curves. All optimizations were performed using identical planning objectives and constraints to ensure consistency across plans. This approach allowed assessment of the impact of HU–RED calibration variations on both the optimization process and the resulting dose distributions.
Dosimetric Analysis
Dose-volume histograms (DVHs) were exported for quantitative analysis according to ICRU Report 83 recommendations [23]. The following parameters were evaluated:
PTV: Dmax (maximum dose), Dmin (minimum dose), Dmean (mean dose), conformity index (CI), and homogeneity index (HI).
Bladder: V25Gy, V35Gy, V50Gy (percentage of volume receiving specified dose).
Rectum: V25Gy, V35Gy, V50Gy.
Femoral heads: Dmax (bilateral).
The conformity index was calculated according to the Paddick formulation [24]:
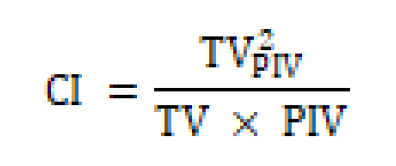
Where TVPIV is the target volume covered by the prescription isodose, TV is the target volume, and PIV is the prescription isodose volume. A CI value of 1.0 indicates perfect conformity.
The homogeneity index was defined according to ICRU 83 [23]:
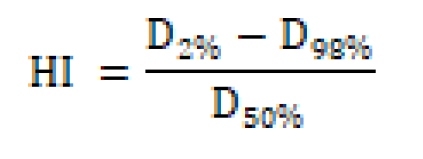
Where D2%, D98%, and D50% represent the doses covering 2%, 98%, and 50% of the PTV, respectively. Lower HI values indicate better dose homogeneity.
Relative differences were calculated as: % Error = [(Modified - Reference) / Reference] × 100.
Statistical Analysis
Given the paired nature of the data (same patients, different calibration curves) and the small sample size (n=10), the non-parametric Wilcoxon signed-rank test was employed to compare dosimetric parameters between the reference and modified calibration curves. A two-sided p-value < 0.05 was considered statistically significant. Descriptive statistics are presented as mean ± standard deviation (SD).
Results
Patient and Plan Characteristics
The study cohort included 10 patients with a median age of 68 years (range: 54-76 years). The mean PTV volume was 142.3 ± 38.7 cm³. All reference plans met the clinical acceptance criteria, with mean PTV D95% of 74.71 ± 1.37 Gy (95.78% of prescription) and all OAR constraints satisfied.
PTV Dosimetric Parameters
[Table 1]. Summarizes the dosimetric parameters for the PTV across the three calibration curves. The CT +50 HU shift produced minimal changes in all PTV parameters. The maximum dose (Dmax) showed a negligible increase of 0.15% (80.48 ± 0.53 Gy to 80.60 ± 0.86 Gy, p = 0.953), and the mean dose (Dmean) remained essentially unchanged (0.03% difference, p = 0.50). These variations were not statistically significant and remained well within clinical tolerance levels. In contrast, the CT +200 HU shift resulted in statistically significant reductions in key PTV parameters. The Dmax decreased by 1.55% (79.23 ± 1.52 Gy, p = 0.037), and Dmean decreased by 1.26% (74.71 ± 1.37 Gy, p = 0.043). The minimum dose (Dmin) showed a non-significant decrease of 1.62% (p = 0.73). The conformity index showed a notable response to HU variations. No significant change was observed with CT+50 (CI: 1.009 ± 0.052 vs. 1.002 ± 0.028, p = 0.441), but the CT+200 shift resulted in a highly significant increase in CI to 1.071 ± 0.078 (6.89% increase, p = 0.008), indicating deterioration in dose conformity. The homogeneity index remained stable across all curves (HI: 0.078–0.082), with no statistically significant differences (p = 0.138 and p = 0.074 for CT+50 and CT+200, respectively).
| Parameter | CT +0 UH (Reference=A) | CT +50 UH | CT +200 UH | Pvalue (A vs B) | Pvalue (A vs C) |
|---|---|---|---|---|---|
| (B) | (C) | ||||
| PTV | |||||
| Dmax (Gy) | 80.48 ± 0.53 | 80.60 ± 0.86 | 79.23 ± 1.52 | 0.953 | 0.037 |
| Dmin (Gy) | 60.54 ± 1.29 | 61.82 ± 3.41 | 59.56 ± 2.26 | 0.721 | 0.73 |
| Dmean (Gy) | 75.66 ± 0.45 | 75.64 ± 0.82 | 74.71 ± 1.37 | 0.5 | 0.043 |
| CI | 1.002 ± 0.028 | 1.009 ± 0.052 | 1.071 ± 0.078 | 0.441 | 0.008 |
| HI | 0.078 ± 0.007 | 0.082 ± 0.008 | 0.082 ± 0.003 | 0.138 | 0.074 |
| Bladder | |||||
| V25Gy (%) | 3.67 ± 2.93 | 3.48 ± 2.94 | 2.27 ± 3.36 | 0.445 | 0.005 |
| V35Gy (%) | 5.69 ± 3.59 | 6.74 ± 4.14 | 6.40 ± 3.92 | 0.388 | 0.721 |
| V50Gy (%) | 8.72 ± 4.59 | 8.82 ± 4.49 | 10.54 ± 7.65 | 0.515 | 0.683 |
| Femoral Heads | |||||
| Left Dmax (Gy) | 69.21 ± 5.09 | 68.51 ± 4.73 | 65.99 ± 5.75 | 0.047 | 0.005 |
| Right Dmax (Gy) | 68.79 ± 4.72 | 67.16 ± 4.56 | 66.60 ± 4.37 | 0.083 | 0.005 |
| Rectum | |||||
| V25Gy (%) | 9.93 ± 2.87 | 9.84 ± 3.92 | 9.22 ± 3.11 | 0.283 | 0.169 |
| V35Gy (%) | 16.27 ± 4.14 | 17.61 ± 4.52 | 15.50 ± 3.82 | 0.508 | 0.308 |
| V50Gy (%) | 25.67 ± 7.61 | 27.23 ± 7.01 | 24.38 ± 7.42 | 0.878 | 0.359 |
Table 1: Dosimetric parameters for PTV and organs at risk across the three HU-RED calibration curves (mean ± SD). Statistical comparisons performed using Wilcoxon signed-rank test
Organs at Risk Dosimetric Parameters
Bladder
The bladder demonstrated the highest sensitivity to HU-RED calibration variations among all OARs evaluated [Table 2]. Under the CT+50 condition, bladder parameters showed modest, non-significant changes: V25Gy decreased from 3.67 ± 2.93% to 3.48 ± 2.94% (5.18% relative change, p = 0.445), and V50Gy showed minimal change (1.15%, p = 0.515). However, the CT+200 shift produced substantial and statistically significant changes in low-dose bladder exposure. The V25Gy decreased significantly to 2.27 ± 3.36% (38.15% relative reduction, p = 0.005). In contrast, higher-dose parameters (V35Gy and V50Gy) showed variable responses without reaching statistical significance (p = 0.721 and p = 0.683, respectively).
| Parameter | % Error (CT+50 vs CT+0) | % Error (CT+200 vs CT+0) |
|---|---|---|
| Dmax (PTV) | 0.15% | 1.55% |
| Dmin (PTV) | 2.11% | 1.62% |
| Dmean (PTV) | 0.03% | 1.26% |
| CI | 0.70% | 6.89% |
| HI | 5.13% | 5.13% |
| V25Gy (Bladder) | 5.18% | 38.15% |
| V35Gy (Bladder) | 18.45% | 12.48% |
| V50Gy (Bladder) | 1.15% | 20.87% |
| Dmax Left Femoral Head | 1.01% | 4.65% |
| Dmax Right Femoral Head | 2.37% | 3.18% |
| V25Gy (Rectum) | 0.91% | 7.15% |
| V35Gy (Rectum) | 8.24% | 4.73% |
| V50Gy (Rectum) | 6.08% | 5.03% |
Table 2: Relative percentage differences between modified calibration curves and the reference curve.
Rectum
In contrast to the bladder, rectal dosimetric parameters demonstrated remarkable stability across all calibration scenarios. None of the evaluated metrics (V25Gy, V35Gy, V50Gy) showed statistically significant differences between the reference and modified curves (all p > 0.05). The maximum relative change observed was 8.24% for V35Gy with CT+50 (p = 0.508), and 7.15% for V25Gy with CT+200 (p = 0.169). This stability suggests that rectal dose metrics are relatively robust to HU calibration uncertainties in prostate VMAT planning.
Femoral Heads
The femoral heads exhibited intermediate sensitivity to HU variations. For the left femoral head, Dmax showed a significant decrease with both CT+50 (1.01% reduction, p = 0.047) and CT+200 (4.65% reduction, p = 0.005). The right femoral head demonstrated similar trends, with significant changes only for the CT+200 condition (3.18% reduction, p = 0.005). The borderline significance observed for CT+50 on the left femoral head (p = 0.047) suggests that bony structures may be more susceptible to minor HU variations than previously anticipated, although the clinical relevance of these small absolute changes remains limited given the substantial margin to dose constraints.
DISCUSSION
This study systematically evaluated the dosimetric consequences of HU-RED calibration variations on prostate VMAT treatment plans. Our findings provide quantitative evidence supporting current quality assurance tolerance recommendations while highlighting the clinical structures most sensitive to calibration errors.
The minimal dosimetric impact observed with the +50 HU shift (<0.5% for PTV Dmean) corroborates previous studies and validates established tolerance thresholds. Similar findings were reported [25], with dose differences below 1% for HU variations within ±40 HU in soft tissue-dominated treatment sites. Our results extend these observations specifically to the prostate VMAT context, confirming that routine scanner variability is unlikely to compromise treatment quality.
The significant dosimetric changes observed with the +200 HU shift underscore the importance of maintaining calibration accuracy. The 1.26% reduction in PTV Dmean and 6.89% increase in conformity index represent clinically meaningful deviations that could affect treatment outcomes. These findings align with theoretical predictions based on the physics of photon interactions; overestimation of electron density leads to overestimation of attenuation, resulting in dose underestimation throughout the treatment volume [26].
The differential sensitivity of OARs to HU variations observed in our study has important clinical implications. The bladder's high sensitivity (up to 38.15% relative change in V25Gy) can be attributed to its soft-tissue composition and anatomical position adjacent to the high-dose gradient region. Similar findings, who noted enhanced sensitivity of bladder dose metrics to density uncertainties in prostate intensity-modulated radiation therapy (IMRT) plans [27].
Conversely, the stability of rectal parameters across all calibration scenarios was unexpected. This may be explained by the rectum's posterior position relative to the PTV, where beam entry and exit patterns result in different dose deposition characteristics compared to the anteriorly positioned bladder. Additionally, the preparation protocol ensuring consistent rectal filling may have contributed to reduced sensitivity [28].
The moderate sensitivity of femoral heads to HU variations warrants attention. While bony structures have higher and more stable electron densities than soft tissues, the significant dose reductions observed (up to 4.65%) suggest that the assumption of reduced bone sensitivity may not be universally valid. This finding aligns with recent work who demonstrated that bone dose calculations can be affected by calibration errors, particularly at tissue-bone interfaces [29].
Limitations
Several limitations should be acknowledged. First, the sample size of 10 patients, while sufficient for initial characterization, limits statistical power and generalizability. Second, we applied uniform HU shifts across the entire calibration curve, whereas real-world calibration errors may affect specific tissue density ranges differently. Third, the study focused on a single institution, scanner, and TPS combination; results may vary with different equipment configurations. Fourth, only systematic positive HU shifts were evaluated; negative shifts and random variations may produce different dosimetric patterns. Finally, we did not assess the impact on biological outcome models (TCP/NTCP), which would provide additional clinical context.
Clinical Implications
Based on our findings, we recommend maintaining HU calibration accuracy within ±50 HU for prostate radiotherapy applications, with particular attention to soft-tissue regions. Quality assurance protocols should include regular phantom-based verification (monthly or after service) with action levels triggered when HU deviations exceed 50 HU for water-equivalent materials. For departments managing multiple scanners or implementing adaptive radiotherapy protocols where patients may be scanned on different systems, scanner-specific calibration curves should be employed to minimize systematic errors.
Conclusion
This study demonstrates that HU-RED calibration variations within routine tolerance ranges (+50 HU) produce minimal dosimetric impact (<1%) on prostate VMAT treatment plans, supporting current quality assurance recommendations. However, larger calibration errors (+200 HU) result in statistically and potentially clinically significant dose deviations, particularly affecting soft-tissue structures such as the bladder. The conformity index proved to be a sensitive indicator of calibration-related dosimetric perturbations.
Our findings emphasize the importance of rigorous CT calibration protocols, regular quality assurance verification, and the use of scanner-specific HU-RED conversion curves in clinical practice. Future studies with larger cohorts and multi-institutional designs are warranted to further refine tolerance recommendations and evaluate the impact on clinical outcomes.
Authorship Statement
All authors have read and approved the final version of the manuscript. They agree with the content, data accuracy, and presentation, and consent to its submission for publication. Each author contributed significantly to the work and accepts responsibility for its integrity.
Funding
The authors declare that no funds, grants, or other support were received during the preparation of this manuscript.
Competing Interests
The authors have no relevant financial or non-financial interests to disclose.
Author Contributions
All authors contributed to the study conception and design.
Ethics Approval
This retrospective study was conducted in accordance with institutional and national ethical standards. Ethical approval was waived by the local ethics committee due to the retrospective nature of the study and the use of anonymized patient data, with no impact on patient management.
Consent to Participate
Informed consent was waived because of the retrospective design of the study and the use of fully anonymized data.
Consent to Publish
Not applicable. This study did not include any identifiable individual data.
Data Availability
The data supporting the findings of this study are available from the corresponding author upon reasonable request.
References
- Hattal I, Rrhioua A, El Outmani A, Zerfaoui M, Bakari, D, et al. (2026) Evaluation of the impact of anatomical region-specific HU-RED conversion curves on VMAT treatment planning for head and neck cancer. Egyptian Journal of Radiology and Nuclear Medicine 57: 5.
- El Outmani A, Zerfaoui M, Hattal I, Rrhioua A, Bakari D, et al. (2025) Evaluation of the impact of slice thickness on CT and cone beam CT image quality in radiotherapy. Onkologia i Radioterapia 19: 1–9.
- El Outmani A, Zerfaoui M, Hattal I, Oulhouq Y, Bahhous K, et al. (2025) Evaluation of volumetric modulated arc therapy dose calculation plans based on kV-cone beam CT images for the breast cancer treatment. Physical and Engineering Sciences in Medicine 48: 1389-1398.
- Tai DT, Tuyen PN, Tuan HD, Hung HT, Kandemir R, et al. (2025) Scanning protocol influence on relative electron density-CT number calibrations and radiotherapy dose calculation for a Halcyon Linac. Radiation Physics and Chemistry 112760.
- Ohira S, Mochizuki J, Niwa T, Endo K, Minamitani M, et al. (2024) Variation in Hounsfield unit calculated using dual-energy computed tomography: comparison of dual-layer, dual-source, and fast kilovoltage switching technique. Radiological Physics and Technology 17: 458-466.
- Davis AT, Muscat S, Palmer AL, Buckle D, Earley J, et al. (2020) Radiation dosimetry changes in radiotherapy treatment plans for adult patients arising from the selection of the CT image reconstruction kernel. BJR| Open 1: 20190023.
- Davis AT, Palmer AL, Pani S, Nisbet A. (2018) Assessment of the variation in CT scanner performance (image quality and Hounsfield units) with scan parameters, for image optimisation in radiotherapy treatment planning. Physica Medica 45: 59-64.
- Nhila O, Talbi M, El Mansouri MH, El Katib M, Chakir EM. (2022) Evaluation of CT acquisition protocols effect on Hounsfield units and optimization of CT-RED calibration curve selection in radiotherapy treatment planning systems. Moscow University Physics Bulletin 77: 661-671.
- Mutic S, Palta JR, Butker EK, Das IJ, Huq MS, et al. (2003) Quality assurance for computed‐tomography simulators and the computed‐tomography‐simulation process: report of the AAPM Radiation Therapy Committee Task Group No. 66. Medical physics 30: 2762-2792.
- IAEA (Corporate Author). (2012) Quality assurance programme for computed tomography: diagnostic and therapy applications. International Atomic Energy Agency.
- International Atomic Energy Agency. (2004) Commissioning and quality assurance of computerized planning systems for radiation treatment of cancer. IAEA Technical Reports Series No. 430.
- Samir F, Meaz TM, Hussiny FA, Ahmed AA, Mahmoud AA, et al. (2023) Analytical dosimetric study of intensity-modulated radiotherapy (IMRT) and volumetric-modulated arc therapy (VMAT) for prostate cancer. Journal of Cancer Research and Clinical Oncology 149: 6239-6246.
- Choi JH, Park H, Oh DH, Ryu H, Yoo L, Chun M. (2025) Organs-at-Risk Dose Reduction with Dual Gantry Arc Increment Values in VMAT for Prostate Cancer. Radiation Physics and Chemistry 113020.
- Penev D, Stavrev P, Stavreva N, Pressyanov D. (2023) Influence of dose uncertainty on TCP estimates: a model study. The European Physical Journal Special Topics 232: 1543-1547.
- Lechner W, Palmans H. (2025) Uncertainty estimation for dosimetry in radiation oncology. Physics and Imaging in Radiation Oncology 100773.
- Vergalasova I, McKenna M, Yue NJ, Reyhan M. (2020) Impact of computed tomography (CT) reconstruction kernels on radiotherapy dose calculation. Journal of Applied Clinical Medical Physics 21: 178-186.
- Singhrao K, Dugan CL, Calvin C, Pelayo L, Yom SS, et al. (2024) Evaluating the Hounsfield unit assignment and dose differences between CT‐based standard and deep learning‐based synthetic CT images for MRI‐only radiation therapy of the head and neck. Journal of Applied Clinical Medical Physics 25: e14239.
- Afifi MB, Eldib AA, Ataalla NN. (2024) Impact of CT tube voltage variation on calculated dose radiotherapy: A simulation and phantom study. Journal of Radiation Research and Applied Sciences 17: 100997.
- Sueangamiam K, Prasomsap K, Yenprasert S, Titalakkana A, Kittiva N. (2026) Effect of tube voltage and current on CT number–relative electron density calibration and radiotherapy dose calculation accuracy. Journal of Radiation Research and Applied Sciences 19: 102151.
- Nomura M, Goto S, Yoshioka M, Kato Y, Tsunoda A, et al. (2025) Impact of differences in computed tomography value-electron density/physical density conversion tables on calculate dose in low-density areas. Physical and Engineering Sciences in Medicine 1-11.
- Michalski JM, Lawton C, El Naqa I, Ritter M, O'Meara E, et al. (2010) Development of RTOG consensus guidelines for the definition of the clinical target volume for postoperative conformal radiation therapy for prostate cancer. International Journal of Radiation Oncology Biology Physics 76: 361-368.
- Michalski JM, Gay H, Jackson A, Tucker SL, Deasy JO. (2010) Radiation dose–volume effects in radiation-induced rectal injury. International Journal of Radiation Oncology Biology Physics 76: S123-S129.
- International Commission on Radiation Units and Measurements. (2010) Prescribing, recording, and reporting photon-beam intensity-modulated radiation therapy (IMRT). Journal of the ICRU 10.
- Paddick I. (2000) A simple scoring ratio to index the conformity of radiosurgical treatment plans. Journal of Neurosurgery 93: 219-222.
- Chourak H, Barateau A, Greer P, Lafond C, Nunes JC, et al. (2023) Determination of acceptable Hounsfield units uncertainties via a sensitivity analysis for an accurate dose calculation in the context of prostate MRI-only radiotherapy. Physical and Engineering Sciences in Medicine 46: 1703-1711.
- Schneider U, Pedroni E, Lomax A. (1996) The calibration of CT Hounsfield units for radiotherapy treatment planning. Physics in Medicine & Biology 41: 111.
- Murugan P, Manickam R, Rajamanickam T, Muthu S, Dinesan C, et al. (2025) Dosimetric impact of material misassignment in linear Boltzmann transport equation-based external beam radiotherapy dose calculation. Radiological Physics and Technology 18: 1072-1086.
- Roch M, Zapatero A, Castro P, Hernández D, Chevalier M, et al. (2021) Dosimetric impact of rectum and bladder anatomy and intrafractional prostate motion on hypofractionated prostate radiation therapy. Clinical and Translational Oncology 23: 2293-2301.
- Alabedi HH, Alnidawi IH, Mustafa ITM, Mosallam A, Hassan BZ, et al. (2025) Dosimetric impact of different CT-to-RED curves on plans calculated using Eclipse TPS. Egyptian Journal of Radiology and Nuclear Medicine 56: 69.


