Original Research Article - Onkologia i Radioterapia ( 2024) Volume 0, Issue 0
Utilizing support vector machine algorithm and feature reduction for accurate breast cancer detection: An exploration of normalization and hyper parameter tuning techniques
V Shiva Kumar Chary*, Bellamkonda Satya Sai Venkateswarlu, Saketh Vemuri, Venkata Naga Sai Suraj Pasupuleti, Vijaya Babu Burra and Praveen TumuluruV Shiva Kumar Chary, Department of Computer science and Engineering, Koneru Lakshmaiah Education Foundation, Vaddeswaram, Andhra Pradesh, India, Email: valabojushivakumarchary789@gmail.com
Received: 22-Nov-2023, Manuscript No. OAR-23-120739; , Pre QC No. OAR-23-120739(PQ); Editor assigned: 24-Nov-2023, Pre QC No. OAR-23-120739(PQ); Reviewed: 08-Dec-2023, QC No. OAR-23-120739; Revised: 15-Dec-2023, Manuscript No. OAR-23-120739 (R); Published: 25-Dec-2023
Abstract
OIn this work, we will evaluate the impact of Independent Component Analysis (ICA) on a breast cancer decision support system’s feature reduction capabilities. The Wisconsin Diagnostic Breast Cancer (WDBC) dataset will be utilised to construct a one-dimensional feature vector (IC). We will study the performance of k-NN, ANN, RBFNN, and SVM classifiers in spotting mistakes using the original 30 features. Additionally, we will compare the IC-recommended classification with the original feature set using multiple validation and division approaches. The classifiers will be tested based on specificity, sensitivity, accuracy, F-score, Youden’s index, discriminant power, and Receiver Operating Characteristic (ROC) curve. This effort attempts to boost the medical decision support system’s efficiency while minimising computational complexity.
Keywords
Independent Component Analysis (ICA), breast cancer decision support system, feature reduction, Wisconsin Diagnostic Breast Cancer (WDBC) dataset, one-dimensional feature vector, original 30 features, ic-recommended classification, validation, division approaches, specificity, sensitivity, accuracy, f-score, youden’s index, discriminant power, Receiver Operating Characteristic (ROC) curve, medical decision support system, computational complexity, efficiency improvement
Introduction
Breast cancer is a leading cause of mortality among women [1], underlining the significance of effective diagnostics for early detection and treatment. However, present diagnostic procedures largely rely on the competency of physicians and physical tests, leaving them prone to errors [2]. As people may cope with ambiguous assessments, automated breast cancer screening applying machine learning has developed as a practical technique to enhance diagnostic accuracy [3-5]. A study comparing machine learning with human analysis found that machine learning obtained an accuracy of 91.1%, topping even the highly trained physicians at 79.97% [6].
Breast tumours are categorised as benign or malignant, with malignant tumors presenting a serious hazard to life [7]. Artificial Neural Networks (ANN) and Radial Basis Function Neural Networks (RBFNN) have proved helpful in identifying benign and aggressive tumours [8-10]. RBFNN stands out for its easiness, rapid convergence, and competence in pattern recognition [10,11]. However, its performance may diminish as the input dimension expands, due to processing issues [12]. In contrast, Support Vector Machine (SVM) has appeared as a promising tool for data categorization, particularly in high-dimensional feature spaces [13].
To manage the difficulties produced by high-dimensional datasets, dimensionality reduction methods like Principal Component Analysis (PCA) and Independent Component Analysis (ICA) have been utilised [14,15]. ICA, applying higher order statistics, isolates independent components with more information than PCA, minimising data dimensionality while boosting classifier performance and convergence time [12,16,17].
This research focused on studying how ICA-based feature reduction influences breast cancer categorization as benign or aggressive. The WDBC dataset is transformed into a one-dimensional feature vector using ICA. k-NN, ANN, RBFNN, and SVM models are trained and graded using 5/10-fold cross-validation and 20% splitting. Performance metrics, including accuracy, specificity, sensitivity, F-score, Youden’s index, and discriminant power, are generated and illustrated using Receiver Operating Characteristic (ROC) graphs to compare the models.
The study’s technique contains an introduction of the dataset, ICA, k-NN, ANN, RBFNN, SVM, and performance measures in Part 2. Section 3 outlines the approach adopted. Sections 4 to 5 present and appraise the experiment’s results. The investigation finishes in Section 6.
In conclusion, the research seeks to explain opinions on the utility of ICA in decreasing feature dimensions for breast cancer classification. By blending machine learning with dimensionality reduction approaches, this effort seeks to boost early detection and diagnostic accuracy, ultimately leading to better breast cancer outcomes.
Materials and Methods
Data overview
The WDBC collection consists of 569 samples, with 357 being normal and 212 malignant. Each sample is tagged with a unique number, a description (B=normal, M=malignancy), and 30 characteristics. Figure 1 depicts features extracted from a digitally enhanced breast mass Fine Needle Aspirate (FNA) picture.

Figure 1: Breast Fine-Needle Aspiration (FNA) biopsies can diagnose both malignant (a) and benign (b) breast cancers [24].
The mean, standard error, and “worst” values of 10 properties were computed for each cell nucleus, resulting in 30 features [18].
Blind source separation
e.g., In the ICA model, the observed signal is a linear combination of two independently distributed sources.
x=As
In the ICA framework, the observed signal vector x is regarded to be a linear mixture of two independent source signals represented by vector s, and the mixing matrix A holds the unknown mixing coefficients. After estimating A via ICA, the separation matrix W is generated as the inverse of A. By applying W to the detected signal, one may obtain the original source signals.

To construct Independent Components (ICs), the data is centered by subtracting the mean values of variables (similar to PCA). The next step is whitening, which makes the data uncorrelated and each variable has a variance of one. Unlike PCA, which gives eigenvectors for decorrelated data, ICs are obtained via a linear transformation on the uncorrelated data Table 1.
| SNO | 10 Real-world advantages |
|---|---|
| 1 | Radius (Mean of distances from center to points on the perimeter) |
| 2 | Texture ( Standard deviation of grey-scale values) |
| 3 | Perimeter |
| 4 | Area |
| 5 | Smoothness(local variation in radius lengths) |
| 6 | Compactness (perimeter2/area-1.0) |
| 7 | Concavity(severity of concave portions of the contour) |
| 8 | Concave points(number of concave portions of the contour) |
| 9 | Symmetry |
| 10 | Fractal dimension ("coastline approximation"-1) |
Tab. 1. For every cell nucleus, a set of numerical attributes has been calculated.
ici=bTix
To construct Independent Components (ICs), the data is centered by subtracting the mean values of variables (similar to PCA). The next step is whitening, which makes the data uncorrelated and each variable has a variance of one. Unlike PCA, which gives eigenvectors for decorrelated data, ICs are obtained via a linear transformation on the uncorrelated data Table 1.
In this study, the Independent Component (IC) is denoted as “ic,” and the vector necessary to construct it is marked as “b.” To compute the vector “b,” a variable independence-linked objective function is applied. The FASTICA approach, known for its adaptability and interactive qualities, is utilised to compute the ICs in this work [19].
Deep learning networks
The Feedforward Neural Network (FFNN) is often applied in numerous applications thanks to its simplicity of mathematical analysis and good representation capabilities [20,21]. It has demonstrated to be effective in control, signal processing, and pattern recognition applications.
In Figure 2, the FFNN architecture is depicted, with N showing the total number of input patterns and M representing the total number of neurons in the hidden layer. Neurons in the hidden layer examine weighted inputs from the previous layer and pass outputs to neurons in the next layer in the FFNN architecture.

Figure 2: The structural design of a feedforward neural network.
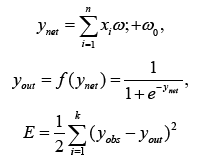
In the Feedforward Neural Network (FFNN), the system output, known as yout, is created using a nonlinear activation function f(ynet). The output ynet is the sum of weighted inputs from the input neurons, where wi specifies the weight of each input neuron xi. Additionally, w0 represents the bias term. The observed neural network output value is represented as yobs. The error between the network result and the output value is represented as E [22].
A Radial Basis Function Neural Network (RBFNN) consists of three layers, like a feedforward architecture, however the hidden layer is known as the radial basis layer and largely uses Gaussian functions. Each neuron in the buried layer is characterised by a Radial Basis Function (RBF) centered on a given location. During training, the centers and dispersion of these RBFs are calculated. To compute the output, a hidden neuron calculates the Euclidean distance between the input vector and the center point of the RBF, and then applies the RBF kernel function based on the distance using the spread value. This method allows the RBFNN to learn and articulate intricate patterns in the data [23-27].
Kernel machine (SVM)
SVM, a supervised learning method, is used for data regression and classification. It was proposed by Boser and Vapnik [28,29]. The SVM technique tries to generate a hyperplane that can differentiate classes with minimal training error and maximum margin, enhancing its generalization ability.
For datasets that can be linearly partitioned, a linear SVM approach is suitable. The objective is to maximize the distance between classes. Support vectors are the data points on the edges of the margin, illustrated by the dotted lines in Figure 3.

Figure 3: A separating boundary in support vector machine.
The discriminant function for the hyperplane, denoted as g(x), is given by
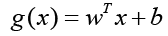
Where w represents the coefficient vector, b is the offset from the
origin, and x denotes the data points. For a data point on one class,
g(x) equals 0, while for the nearest point on the other class, g(x)
equals 0. The support vectors, located on the separating hyperplane,
areee cost function should be minimized while maximizing 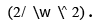
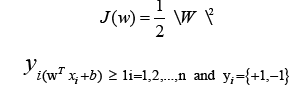
This is a quadratic optimization problem with linear inequality constraints. The Lagrange function is identified using the Karush- Kuhn-Tucker (KKT) criterion [30].
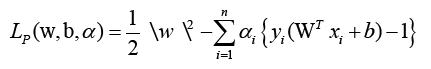
To attain the ideal values of w and b, where I are lagrange multipliers, Lp must be decreased. The following is the optimization equation:
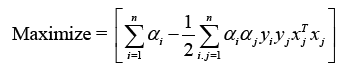
Indeed, the kernel technique is a powerful strategy that allows SVM to solve nonlinear classification challenges. By utilising a kernel function, the data points are transported to a higher-dimensional space (denoted by Φ(X)), where a linear hyperplane may separate the classes. The new discriminant function, g(x), is expressed as
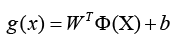
Where W denotes the coefficient vector in the higher-dimensional space, and b is the offset from the origin. This method, SVM may efficiently classify data that may not be linearly separable in the original feature space Table 2.
| Actual value/ Recognized value | Positive | Negative |
|---|---|---|
| Positive | TP | FN |
| Negative | FP | TN |
Tab. 2. A contingency table used for evaluating the performance of a Two-class classification model.
The optimization equation combines mapping input vectors to kernel space X with Φ(X).
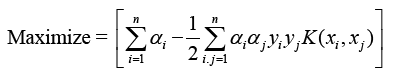
The kernel function K(xi, xj) includes the values Φ(xi) and Φ(xj), where Φ denotes the mapping to kernel space. Common kernel functions include RBFs and polynomials.
Performance measures
Various techniques exist to examine a classifier’s effectiveness. The confusion matrix illustrates correct and inaccurate classifications, with TP, TN, FP, and FN denoting different findings. Classifier accuracy, typically utilised, is calculated as
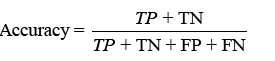
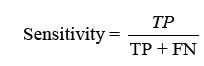
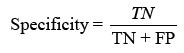
displaying the proportion of correct projections. Sensitivity (TPR) shows the classifier’s capacity to distinguish positive examples, while specificity (TNR) examines its skill to recognise negative instances. F-score combines accuracy and recall, whereas Youden’s index analyses both sensitivity and specificity [31].Receiver Operating Characteristic (ROC) curves analyse performance over several thresholds, and the Area Under the Curve (AUC) represents overall performance.
Sensitivity checks the proper identification of actual positives, whereas specificity rates the detection of true negatives.
The F-score analyses measure accuracy by balancing precision and recall. It tests the classifier’s accuracy and memory performance. When the F-score is 1, accuracy and recall are equally relevant. If it’s 1, recall is emphasised, and if it’s 2, accuracy is prioritised.
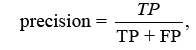
Where is the bias and β = 1 is the F-Score. When the value is 1, recall is valued; when the value is 2, precision is sought.
Discriminant Power (DP) and Youden’s index are two more metrics used to analyze a classifier’s potential to make medical diagnoses. DP tests a classifier’s ability to distinguish between positive and negative samples:
The eventual consequence may be expressed clearly as follows: In the DPs indicated below, the phrases “poor discriminant,” “limited discriminant,” “fair discriminant,” and “great discriminant” are used: 1, 2, and 3.
This study investigates classifier efficacy using Youden’s index and the Receiver Operating Characteristic (ROC) curve. The research contains 5/10-fold Cross-Validation (CV) with 20% data partitioning. CV splits data into subsets for training and testing, assessing the model’s discriminating performance after repeated rounds. Data splitting randomly chooses 20% for testing and employs the remaining for training, being less accurate but easier to perform [32,33].
Literature survey
The domain of medical diagnostics has been considerably changed by the deployment of machine learning and deep learning technology. Several recent research publications have given unique approaches for early disease diagnosis and proper rating in various medical scenarios. For instance, Mohamed created a technique merging convolutional neural networks with two-dimensional discrete wavelet transform to recognise seizures [1]. Agudelo Gaviria and Sarria-Paja described a breast cancer detection strategy applying deep learning models based on digital diagnostic pictures [2]. Amer mdeveloped a technique for identifying lung lesions in CT images using feature integration and a genetic algorithm [3].
Hesham created an ensemble learning-based technique for proper breast cancer labelling [4]. In a similar experiment, Yang constructed an astounding multiple heartbeats categorization model based on convolutional neural networks and bidirectional extended short-term memory [5]. Sumana established an artificial neural network- based technique for identifying nephrolithiasis with KUB ultrasound imaging [6]. Whereas Gunasundari designed a deep convolutional neural network for locating liver lesions with abdominal CT data [7].
Mert proposed a reduced feature set-based model for breast cancer diagnosis [8]. Zhang explored a computer-aided diagnostic approach for breast focal imbalance [9]. Rao made a comparison examination of flaw detection in distribution systems utilising DWT-FFNN and DWT-RBFNN [10]. Thakur created a model for face recognition using posterior distance model-based radial basis function neural networks [11].
Hashim and Alzubaydi established a technique for discerning secret information based on lowered coefficient values of 2DHWT sub- bands [12]. Adnan established an explicit AI-based methodology for monitoring student progress in virtual learning environments [13]. Haruna presented a neuro-genetic model for forecasting crude oil prices [14]. Wanga created a complete regression neural network-based model for assessing chip probe output [15]. Jothikumar designed a more effective remote application monitoring solution leveraging the PROXMOX virtual environment [16].
Finally, Bazatbekov created a 2D face recognition model combining PCA and triplet similarity embedding [17]. These findings highlight the great potential of machine learning and deep learning technology across several fields, including medical monitoring. These occurrences establish a good foundation for further investigation in this area,
Methodology
This research analyses classifier performance on breast cancer data with both the original 30 features and a single feature reduced through ICA. Figure 4 depicts the model applied to WDBC data with 30 attributes, trained and assessed on 569 occurrences (patients).

Figure 4: The fundamental framework of the research.
In this study, we apply ICA to lower the data complexity, and then split the data into subgroups using 5/10-CV and 20% partitioning. ANN, RBFNN, SVM, and k-NN models are taught and assessed following these subgroups. Performance measures including sensitivity, specificity, accuracy, F-score, Youden’s index, DP, and ROC curve are produced from the classification data. The first IC, adopted as a feature vector owing of its high eigenvalue, adequately encapsulates the information of the thirty qualities. Figure 5 depicts this selection technique. Additionally, Figure 6 displays the IC’s distribution, revealing its discriminative features. The diagnostic performance of the algorithms is examined on the test data to show its utility in breast cancer classification

Figure 5: The eigenvalues that correspond to the WDBC dataset.

Figure 6: The estimated IC’s probability density function (feature vector after
dimensionality reduction). 
The k-NN algorithm leverages the one-dimensional Euclidean distance (d=(xtest - xtraining)^2) between test and training data. Performance statistics are retained for the greatest k value, acquired from k values ranging from 1 to 25. The ANN model contains a feedforward neural network with one hidden layer, continuously increasing the number neurons in the hidden layer for best accuracy. The log-sigmoid transfer function is employed for the hidden layer’s activation function, and the network is taught using the gradient descent with momentum and variable learning rate backpropagation technique. Additionally, RBFNN is tested with varying spread value. SVM techniques evaluate linear, quadratic, and RBF kernels for successful breast cancer categorization.
Results
In this study, we utilised the WDBC data to train and evaluate models leveraging a one-dimensional feature vector produced using ICA. We examined accuracy, sensitivity, and specificity for one-dimensionality using a 5/10 CV technique with 20% test data. Sensitivity was stressed because it is crucial in detecting dangerous cancers. The accuracy of the k-NN classifier was tested for k values ranging from 1 to 25, and Figure 7 shows a comparison graph illustrating the effect of ICA on the k-NN classifier’s performance. The findings give vital information on the efficiency of feature reduction using ICA for breast cancer classification.

Figure 7: The estimated IC’s probability density function (feature vector after
dimensionality reduction).  10-fold CV with 30 features;
 10- fold CV with 1 feature.
The study investigated k-NN, ANN, RBFNN, and SVM models to anticipate their highest accuracy for different parameter tweaks. The maximum accuracy obtained was 96.49% while utilising 20% test data and 30 characteristics with k=5. However, with k=5 and 20% test data, the accuracy fell to 92.98% when employing a shorter one-dimensional feature vector produced using ICA. Additionally, adopting 10-CV for training and testing dropped the accuracy of k-NN from 93.15% (30 features) to 91.04% (1 feature via ICA) (Figures 8 and 9).

Figure 8: A graph showing the artificial neural network’s accuracy. Note: 20% Test data with 30 features;
 10-fold CV with 30 features;
 20% test data with 1 feature;
 10- fold CV with 1 feature.

Figure 9: A visualization of the performance of the neural networks with radial basis functions using an accuracy graph. Note: 20% Test data with 30 features;
  10-fold CV with 30 features;
 20% test data with 1 feature;
 10- fold CV with 1 feature.
For ANN, utilising the top 30 characteristics and 20% test data generated 99.12% accuracy with four neurons. The impact of ICA in compressing to one feature enhanced accuracy to 91.23% for nine neurons. However, the accuracy fell from 97.54% to 90.51% after applying 10-CV. RBFNN’s spread value was determined between 0 and 60 with the greatest accuracy employing 20% test data and 10/5-CV, obtaining 95.12% accuracy at a spread value of 48. With a smaller one-dimensional feature vector utilising ICA, the accuracy reduced to 90.35%, but it rose to 90.49% with 10-CV.
SVM performance was assessed using different kernel function values. For 20% test data, SVM applying a linear kernel had an accuracy of 98.25% with 30 features and 90.35% with 1 lowered feature by ICA. ICA boosted the accuracy of SVM with RBF kernel from 89.47% to 91.23% (1 feature). However, when 10-CV was applied, the accuracy fell from 97.54% (30 features, linear kernel) to 90.33% and 90.86%, respectively, for RBF and polynomial kernels (1 feature).
The classifiers’ performance metrics, such as accuracy, specificity, sensitivity, F-score, Youden’s index, and discriminant power, were compared for each parameter variation. ROC curves of three categories were also presented for visual comparison. The measurement utilises 10-CV and an ICA-compressed one-dimensional feature vector. The confusion matrix in Table 3 demonstrates the classifier’s performance, displaying much improved true values as compared to classification with one feature missing using ICA.
| k-NN classifier (k-6) | ANN classifier (neuron number 7) | ||||||||
|---|---|---|---|---|---|---|---|---|---|
| Predicted Measurement | Predicted Measurement | ||||||||
| True Measurement | Cancerous | Harmless | True Measurement | Cancerous | Harmless | ||||
| IF | 30F | IF | 30F | IF | 30F | IF | 30F | ||
| Cancerous | 338 (TP) | 346 | 19(FN) | 11 | Cancerous | 346 (TP) | 357 | 11(FN) | 0 |
| Harmless | 32(FP) | 28 | 180(TN) | 184 | Harmless | 43(FP) | 14 | 169(TN) | 198 |
| RBFNN classifier (spread =28) | SVM classifier (σ =1.3) | ||||||||
| Predicted Measurement | Predicted Measurement | ||||||||
| True Measurement | Cancerous | Harmless | True Measurement | Cancerous | Harmless | ||||
| IF | 30F | IF | 30F | IF | 30F | IF | 30F | ||
| Cancerous | 345 (TP) | 334 | 12(FN) | 23 | Cancerous | 348 (TP) | 343 | 14(FN) | 9 |
| Harmless | 43(FP) | 138 | 169(TN) | 74 | Harmless | 43(FP) | 13 | 169(TN) | 199 |
Tab. 3. Comparing the confusion matrices of the classifiers with one reduced feature (1F) with the original 30 features allows for an investigation of the performance of classifiers with decreased dimensionality using Independent Component investigation (ICA).
| k-NN | ANN | RBFNN | SVM (RBFK) | |||||
|---|---|---|---|---|---|---|---|---|
| IF | 30F | IF | 30F | IF | 30F | IF | 30F | |
| F-score | 92.98 | 94.65 | 92.76 | 98.07 | 92.61 | 80.57 | 93.04 | 96.21 |
| DP | 2.539 | 2.912 | 2.655 | InF | 2.606 | 1.131 | 2.769 | 3.267 |
| Y | 0.795 | 0.839 | 0.766 | 0.934 | 0.763 | 0.284 | 0.772 | 0.899 |
| Accuracy | 91.03 | 93.14 | 90.5 | 97.53 | 90.49 | 87.17 | 90.86 | 95.25 |
| Specificity | 84.9 | 87.26 | 79.71 | 93.39 | 79.71 | 34.9 | 79.71 | 93.86 |
| Sensitivity | 94.67 | 96.63 | 96.91 | 100 | 96.63 | 93.55 | 97.47 | 96.07 |
Tab.4. An analysis of the impact of the ICA algorithm on various performance measures (including sensitivity, specificity, accuracy, and F-score as a percentage) for the classifiers.
| Criterion | k-NN | ANN | RBFNN | SVM | ||||
|---|---|---|---|---|---|---|---|---|
| IF | 30F | IF | 30F | IF | 30F | IF | 30F | |
| AUC | 0.88 | 0.911 | 0.879 | 0.956 | 0.881 | 0.877 | 0.879 | 0.945 |
| 95%CI | 0.86-0.92 | 0.89-0.94 | 0.85-0.91 | 0.94-0.98 | 0.85-0.91 | 0.85-0.91 | 0.85-0.91 | 0.92-0.97 |
Tab.5. Criterion values of the ROC curves of ����-NN, ANN, RBFNN, and SVM
In summary, the study comprehensively investigated the performance of k-NN, ANN, RBFNN, and SVM classifiers with varied parameter values and underlined the effect of feature reduction using ICA on their accuracy and discriminative powers. The results give significant insights into the efficacy of these algorithms for breast cancer categorization tasks (Figure 10).

Figure 10 : A series of graphs demonstrating the effectiveness of several Kernel Machine classifiers. 

Table 4 examines the impact of ICA on the k-NN, ANN, RBFNN, and SVM models using many performance metrics such as sensitivity, specificity, accuracy, F-score, Discriminant Power (DP), and Youden’s index.
Discriminant power examines a classifier’s ability to differentiate between positive and negative data. ANN and SVM demonstrate remarkable separation abilities, with DP ranging from 3 to 30 for 30 different characteristics. When reducing to one dimension, SVM and ICA (ANN) generate DP values of 2.769 and 2.655, respectively, suggesting efficient discriminators.
Youden’s index, which represents a classifier’s capacity to avoid false predictions, attains its best value when k-NN is applied. The classi- fier’s ROC curve, based on Youden’s index, depicts the true positive rate (sensitivity) as a function of the false positive rate (1-specificity). The ROC curve is used to measure the area under the curve (AUC) and its 95% confidence interval (CI). An AUC of 1 reveals flawless classifications, whereas AUC larger than one implies more precise conclusions. The 95% CI, another ROC curve metric, analyses the classifier’s ability to discriminate between classes; quantities bigger than zero signal effective discrimination.
Figure 11 depicts the ROC curves for k-NN, ANN, RBFNN, and SVM models using a one-dimensional feature vector lowered by ICA and the original 30 features. The results reveal insights into the models’ performance and illustrate the advantages of applying ICA in classification tasks.

Figure 11 : To evaluate the sensitivity and specificity of the kNN, ANN, RBFNN, and SVM classifiers, we generated Receiver Operating Characteristic (ROC) curves. SVM RBF (30 features).
Table 5 offers the classifier ROC curves required. AUCs of ANN and SVM improve (0.966 and 0.949) with 30 additional features. For SVM (0.885) and k-NN (0.897), AUC is increased when using a single feature reduction by ICA. This implies SVM and k-NN successfully segregate data using a single feature.
Table 5 reveals that NN trumps ANN, RBFNN, and SVM with a superior k-accuracy of 91.03% compared to their accuracies of 90.50%, 90.49%, and 90.86%, respectively, when using ICA. Interestingly, k-NN, ANN, and SVM indicate decreased accuracy when one feature is omitted, yet RBFNN’s performance rises. Table 6 illustrates a comparison of the computation times for each categorization strategy with the original 30 criteria.
| Discriminator | Segmentation | Intercommunication duration (seconds) | 30 attributes(seconds) |
|---|---|---|---|
| k-NN | 20% 10-CV | 8.02 13.52 | 8.31 14.77 |
| ANN | 20% 10-CV | 11.12 76.72 | 13.9 118.21 |
| RBFNN | 20% 10-CV | 14.9 90.49 | 20.3 129.84 |
| SVM (poly) | 20% 10-CV | 7.17 7.47 | 7.28 9.13 |
| SVM(RBFK) | 20% 10-CV | 9.02 10.72 | 43.30 19.05 |
Tab.6. The execution time required for the classification process.
| Author | Method | Feature number | Accuracy | Sensitivity |
|---|---|---|---|---|
| Krishnan, et al.[33] | 40% test data, SVM (poly) 40% test data, SVM (RBF) | 30 | 92.62% 93.72% | 92.69% 94.50% |
| Bagui,et al.[34] | 64% test data, k-RNN 64% test data,k-RNN | 30 Best 3 | 96.00% 98.10% | 95.09% 98.05% |
| Sweilam,et al.[35] | PSO+ SVM QPSO+SVM | 30 | 93.52% 93.06% | 91.52% 90.00% |
| Mangasarian,et al.[36] | 10-CV,MSM-T | Best 3 | 97.50% | |
| Mert,et al.[37] | 10-CV, PNN LOO,PNN |
3 (2IC+DWT) | 96.31% 97.01% | 98.88% 97.78% |
| Zhang,et al.[38] | k-SVM | 6 | 97.38% | |
| This study | 10-CV,k-NN | 1 feature reduced by ICA | 91.03% | 94.67% |
| 40 % test, k-NN | 92.56% | 94.02% | ||
| 10-CV,ANN | 90.50% | 96.91% | ||
| 40% test, ANN | 90.89% | 97.00% | ||
| 10-CV,RBFNN | 90.49% | 96.63% | ||
| 40% test, RBFNN | 89.98% | 96.01% | ||
| 10-CV,SVM (linear) | 90.33% | 96.35% | ||
| 40% test, SVM (linear) | 90.01% | 95.00% | ||
| 10-CV,SVM (quadratic) | 89.98% | 95.24% | ||
| 40% test, SVM (quadratic) | 91.01% | 96.42% | ||
| 10-CV,SVM (RBF) | 90.86% | 97.47% | ||
| 40% test, SVM (RBF) | 91.03% | 97.56% |
Tab.7. An analysis of the accuracy and methods used in previous research compared to the results and techniques of this study.
In terms of processing time, the proposed techniques outperform straightforward classification of the original dataset. Creating an Independent Component (IC) for classification is significantly less complex than designing a neural network with 30 variables. When ANN and RBFN were divided by 20%, the processing durations dropped from 13.9 to 11.12 seconds and from 20.03 to 14.9 seconds, respectively. The introduction of IC as a feature leads in a noticeable drop in complexity during 10-fold cross-validation, lowering ANN and RBFNN usage durations from 118.21 to 76.72 seconds and 129.84 to 90.49 seconds, respectively. ICA also increases SVM and k-NN estimates substantially.
Breast cancer is more frequent in women, underscoring the signifi- cance of early detection to minimise death rates. Machine learning algorithms, such as SVM, excel in spotting breast cancer occurrences in data. This research makes use of the scikit-learn, pandas, seaborn, matplotlib, and numpy tools, and the breast cancer dataset was imported using scikit-learn’s load breast cancer function. Exploration of the dataset’s features, objective variables, and relationships indicates significant drivers for effective breast cancer diagnosis while avoiding over fitting by deleting marginally relevant properties.
Other visualisations, such as heat maps, pair plots, count plots, and scatter plots, offered insights into the data’s properties. The identi- fication of numerous significantly connected features showed their potential as effective breast cancer indicators. These findings stress the necessity of feature selection in creating an efficient and accurate classification model Figures 12-15.

Figure 12: Pair plot of cancer data with selected features.

Figure 13: Count plot distribution of target in cancer data. 

Figure 14: Scatterplot of mean area vs. mean smoothness with target.

Figure 15: Correlation heat map of cancer data features.
To divide the dataset into training and testing sets, we utilised the scikit-learn test-split technique. SVM training on the training set gave 96% accuracy, exhibiting excellent performance. Figures 16 and 17 show the heatmap and categorization report, respectively.

Figure 16: Heat map of 96% accuracy.

Figure 17: Classification report of 96% accuracy.
To increase the model’s performance, we incorporated normalisation and scaling features with a mean of zero and a standard deviation of one. Through feature aggregation, our strategy lowered the effect of outliers while boosting accuracy. We then fine-tuned SVM’s hyper parameters using scikit-Grid Search, adjusting C and gamma values. This adjustment resulted in a 97% increase in accuracy. The graphic in Figure 18 and the categorization report in Figure 19 clearly illustrate the large increase gained with these improvements

Figure 18: Heat map of 97% accuracy.

Figure 19: Classification report of 97% accuracy.
We were able to properly identify breast cancer using the SVM technique. Machine learning technologies have the potential to enhance recognition models. More study is necessary to find techniques and strategies for enhanced efficiency.
Discussion
Sensitivity and specificity are crucial parameters in cancer classification, reflecting the accurate identification of genuine positives and negatives, respectively. Interestingly, when applying a one-dimensional feature vector reduced by ICA, the accuracy of classifiers substantially reduces, but SVM and RBFNN classifiers demonstrate increased sensitivity levels. Particularly, SVM with an RBF kernel and just one feature delivers the maximum sensitivity level. Figure 20 simply demonstrates the impact of ICA on the sensitivity parameters of the classifier.

Figure 20: A comparison of the sensitivity scores among the classifiers. 
Greater sensitivity in cancer categorization indicates enhanced detection of malignant samples, enabling doctors to more properly identify carcinogenic masses and distinguish malignant tumors. To analyse the impact of ICA-based feature reduction, Table 7 displays accuracy and sensitivity metrics from past classification efforts, alongside the newest study utilising the WDBC dataset. Notably, the WBC dataset was also utilised in research unrelated to the WDBC study.
The incorporation of a large number of criteria assists the differentiating between benign and aggressive breast cancer patients. The reduction of ICA features into a single feature has a major effect on the accuracy of k-NN, ANN, and SVM classifiers. This feature reduction, on the other hand, boosts the sensitivity and accuracy of SVM and RBFNN classifiers.
As indicated in Table 7, the analysis of classifiers applying the one-dimensional feature vector created by ICA offers remarkable results, outperforming other approaches in terms of sensitivity measures. Nonetheless, the recommended categories’ accuracy ratings are substantially lower (90.53% 0.34%) than those derived by prior approaches (94.93% 2.07). For example, employing a 6-dimensional feature space obtained by the K-means approach, a hybrid methodology combining Discrete Wavelet Transform (DWT) and ICA gave exceptional 10-CV accuracy rates of 96.31% and 97.38% with SVM and PNN, respectively. Notably, WDBC data providers attained the greatest accuracy of 97.50% by applying the Multisurface Method Tree (MSMT) with three provided features [38]. In terms of scores, additional SVM-based study applying 30 criteria [36,38] indicated equivalent outcomes to our one-dimensional findings.
Conclusion
In this research, we aim to explore the impact of dimensionality reduction using Independent Component Analysis (ICA) on breast cancer decision support systems, employing a diverse range of classifiers such as Artificial Neural Networks (ANN), k-Nearest Neighbors (k-NN), Radial Basis Function Neural Networks (RBFNN), and Support Vector Machines (SVM). We will compare the results obtained from the reduced one-dimensional feature vector created using ICA with the original thirty features of the Wisconsin Diagnostic Breast Cancer (WDBC) dataset.
The early findings show remarkable trends in the categorization accuracy rates. While the accuracy rates for other classifiers declined considerably by using the less features, the RBFNN classifier stood out dramatically. It demonstrates a large boost in accuracy from 87.17% to 90.49% using the one-dimensional feature vector. Moreover, both RBFNN and SVM demonstrated improved sensitivity rates for accurately categorising malignant samples, suggesting its potential in identifying breast cancer patients effectively.
The findings shows that feature reduction using ICA may be a desirable method, particularly when endeavouring to enhance the detection rate of malignant breast cancer patients consistently, while preserving good accuracy. Additionally, this strategy may lead to lower computational complexity, making it an appealing choice for practical applications. As we delve further into the inquiry, we aim to unearth novel insights about the benefits and limitations of ICA- based dimensionality reduction in breast cancer diagnosis.
References
- Mohamed G, Eldib H, Sharkas M. Seizure prediction using two-dimensional discrete wavelet transform and convolution neural networks. InIDDM. 2021;4:100-108.
- Agudelo GH, Sarria PM. Breast cancer detection using digital histopathology images and pre-trained deep learning models. Journal of Computer and Electronic Sciences: Theory and Applications. 2021 Dec 14;2(2):27.
- Amer HM, Elmikati HA, Abou-Chadi FE, et al. Detection of lung nodules in ct images using features fusion and genetic algorithm. International Journal of Scientific & Engineering Research. 2017;8: 1632-1639.
- Hesham A, El-Rashidy N, Rezk A, et al. Towards an accurate breast cancer classification model based on ensemble learning. Int J Adv Comput Sci Appl. 2022; 13:590-602.
- Yang M, Liu W, Zhang H. A robust multiple heartbeats classification with weight-based loss based on convolutional neural network and bidirectional long short-term memory. Front Physiol. 2022;13:2533.
[Crossref] [Google Scholar] [PubMed]
- Sumana G, Aparna G, Anitha Mary G. An artificial neural networks feature extraction approach to predict nephrolithiasis (kidney stones) based on kub ultrasound imaging. Smart Computing Techniques and Applications.2021;1: 583-596.
- Gunasundari S, Meenambal S, Tamilselvi S, et al. Deep convolution neural network in classification of liver tumour as benign or malignant from abdominal computed tomography. ICICICT(IEEE). 2022; 11: 654-660.
- Mert A, Kılıç N, Bilgili E, et al. Breast cancer detection with reduced feature set. Comput Math Methods Med. 2015;19: 265138.
[Crossref] [Google Scholar] [PubMed]
- Zhang Z. Investigation of a computer-aided detection solution for breast focal asymmetry. 2011.
- Rao TS, Ram ST, Subrahmanyam JB. Comparative analysis of fault diagnosis in distribution system with the aid of DWT-FFNN and DWT-RBFNN. Artificial Intelligence and Evolutionary Computations in Engineering Systems.2018; 585-596.
- Thakur S, Sing JK, Basu DK, et al. Face recognition using posterior distance model based radial basis function neural networks. InPattern Recognition and Machine Intelligence: Third International Conference.2009 :470-475.
- Hashim SM, Alzubaydi DA. Identify the presence of hidden information based on lower coefficients value of 2dhwt sub-bands. 7th International Engineering Conference “Research & Innovation amid Global Pandemic"(IEC). 2021;156-161.
- Adnan M, Uddin MI, Khan E, et al. Earliest possible global and local interpretation of students’ performance in virtual learning environment by leveraging explainable AI. IEEE Access. 2022;10:129843-64.
- Haruna C. Neuro-genetic model for the projection of crude oil price capable of handling of uncertainty/haruna chiroma. 2015.
- Wanga, Chien-Chih, Chi-Hung Kuoa, et al. Wafer probe yield prediction modeling based on general regression neural network to improve DRAM processes.2019.
- Jothikumar R, Susi S, Subramaniam K, et al. Improving the efficiency and performance of remote application monitoring system by proxmox virtual environment. Journal of Computational and Theoretical Nanoscience. 2019;16(2):773-7.
- Bazatbekov B, Turan C, Kadyrov S, et al. 2D face recognition using PCA and triplet similarity embedding. Bulletin of Electrical Engineering and Informatics.2023; 12(1):580-6.
- Smith ER. Algorithms and geometric analysis of data sets that are invariant under a group action. 2010.
- Rizayeva A, Nita MD, Radeloff VC. Large-area, 1964 land cover classifications of Corona spy satellite imagery for the Caucasus Mountains. Remote sensing of environment. 2023; 284:113343.
- Kota S. Dimensionality reduction and fusion strategies for the design of parametric signal classifiers. 2010
- Patil MN, Khandagale MH. A review on multilevel wrapper verification system with maintenance model enhancement. International Journal of Advanced Engineering Research and Science. 2016; 3(12) :236944.
[Crossref] [Google Scholar] [PubMed]
- Wolberg WH, Street WN, Mangasarian OL. Machine learning techniques to diagnose breast cancer from image-processed nuclear features of fine needle aspirates. Cancer lett. 1994;77(2-3):163-71.
- Liu KH, Li B, Wu QQ, et al. Microarray data classification based on ensemble independent component selection. Comput Biol Med. 2009;39(11):953-60.
[Crossref] [Google Scholar] [PubMed]
- Seizure prediction using two-dimensional discrete wavelet transform and convolution neural networks
- Bilski J. The UD RLS algorithm for training feedforward neural networks. International Journal of Applied Mathematics and Computer Science. 2005;1(15):115-23.
- Sivri N, Kilic N, Ucan O. Estimation of stream temperature in Firtina Creek (Rize-Turkiye) using artificial neural network model. J Environ Biol. 2007;28(1):67-72.
[Google Scholar] [PubMed]
- Abdalla OA, Zakaria MN, Sulaiman S, et al. A comparison of feed-forward back-propagation and radial basis artificial neural networks: A Monte Carlo study. international symposium on information technology. 2010; 2: 994-998.
- Boser BE, Guyon IM, Vapnik VN. A training algorithm for optimal margin classifiers. Proceedings of the fifth annual workshop on Computational learning theory. 1992; 1:144-152).
- Vapnik VN. The nature of statistical learning theory. 840 Springer-Verlag New York. 1995;841:842.
- Courant R, Hilbert D. Methods of Mathematical Physics. Wiley.1953
- Youden WJ. Index for rating diagnostic tests. Cancer. 1950;3(1):32-5.
[Crossref] [Google Scholar] [PubMed]
- Pesce LL, Metz CE. Reliable and computationally efficient maximum-likelihood estimation of “proper” binormal ROC curves. Acad Radiol. 2007;14(7):814-29.
[Crossref] [Google Scholar] [PubMed]
- Hamidzadeh J, Monsefi R, Sadoghi Yazdi H. DDC: distance-based decision classifier. Neural computing and applications. 2012;21:1697-707.
- Krishnan MM, Banerjee S, Chakraborty C, et al. Statistical analysis of mammographic features and its classification using support vector machine. Expert Systems with Applications. 2010;37(1):470-8.
- Bagui SC, Bagui S, Pal K, et al. Breast cancer detection using rank nearest neighbor classification rules. Pattern recognition. 2003;36(1):25-34.
- Sweilam NH, Tharwat AA, Moniem NA. Support vector machine for diagnosis cancer disease: A comparative study. Egyptian Informatics Journal. 2010;2(11):81-92.
- Mangasarian OL, Street WN, Wolberg WH. Breast cancer diagnosis and prognosis via linear programming. Operations Research. 1995;43(4):570.
- Mert A, Kılıç N, Akan A. An improved hybrid feature reduction for increased breast cancer diagnostic performance. Biomedical Engineering Letters. 2014 ;4:285-91.
- Zheng B, Yoon SW, Lam SS. Breast cancer diagnosis based on feature extraction using a hybrid of K-means and support vector machine algorithms. Expert systems with applications. 2014;41(4):1476-82.


