Research Article - Onkologia i Radioterapia ( 2021) Volume 15, Issue 11
2Department of Radiotherapy, Cheikh Zaïd International University Hospital, Rabat, Morocco
3Department of Physics, Faculty of Science Dhar El Mahraz, Sidi Mohamed Ben Abdellah University, Fez, Morocco
Rachid Errifai, Department of Physics, Faculty of Science, Mohammed V University, Rabat, Morocco, Email: rachiderrifai@gmail.com
Received: 26-Sep-2021 Accepted: 21-Oct-2021 Published: 25-Oct-2021
Abstract
Radiotherapy treats cancer by using ionising radiations. Over the last few years, it has evolved a lot and some very innovative techniques have appeared. We have chosen to compare these techniques which are: Intensity Modulated Radiation Therapy (IMRT); Volumetric Modulated Arc Therapy (VMAT). The treatment plans of 10 patients were compared and treated with Intensity Modulated Radiation Therapy (IMRT) Step and Shoot (SS), Sliding Window (SW), and VMAT (6MV X-ray beam). Three target volumes were used: PTV 76, PTV 62.7, and PTV 57. The organs at risk delineated were the rectum, the bladder, small intestine. The dose was delivered once a day, five days a week and in 38 sessions in integrated boost (Simultaneous Integrated Boost) (SIB), aiming to deliver the prescribed dose to the tumour volume while respecting the dose constraints in the organs at risk and minimizing their degree of toxicity. Similar results were found for target volume coverage (Dmax). VMAT seems to be the best of these techniques because it is the best at sparing organs at risk. IMRT has almost the same results, but VMAT is much faster. Finally, there was no statistically significant difference between the different techniques. All these results confirm the conformational capacities of these innovative techniques, from a dosimetric and above all clinical point of view as well as their ability to cover the target volumes while largely respecting the constraints on organs at risk.
Keywords
prostate cancer, radiotherapy, VMAT, IMRT, step and shoot, sliding window
Introduction
Prostate cancer is the first cancer in men and is a real public health problem. According to 2005 data from the Rabat Region Cancer Registry (RECRAB), prostate cancer is the second cancer in humans after bronchopulmonary cancers with a standardized impact on the world population. Clinicians are still looking for the optimal planning methods of treating prostate cancer with external beam radiation therapy. The role of radical dose in radiation therapy has been established in the management of non-metastatic prostate cancer [1]. Previously, radiation treatment was matched to the height and width of the target volume, meaning that the normal structures were exposed to the beams. Advances in imaging technology have made it feasible to locate and treat the tumour more precisely. In recent years, 3 Dimensional Conformal Radiation Therapies (3DCRT) have commonly been used. By using CT or MRI scans tumour can be seen in three dimensions.
Radiotherapy consists of treating tumours by using highenergy ionizing radiation, the biological effects of which lead to the death of cancer cells. The objective of this therapeutic weapon is to deliver a sufficient tumoricidal dose to eradicate the tumour and at the same time the lowest possible dose to spare neighbouring healthy tissues reducing thus the risk of complications. Nowadays, the irradiation techniques have considerably evolved to achieve this objective [2]. Indeed, recent developments in radiotherapy techniques have emerged, and more particularly for conformational radiotherapy with IMRT [3] which itself has given rise to VMAT [4] which permitted for sculpted irradiation, where high dose regions are adjusted to target volumes, even those of complex shape. During the treatment of these cancers by external radiotherapy, it is advisable to spare as much as possible the healthy tissues adjacent to the tumour. In the present work, among these healthy tissues, some structures are particularly sensitive to irradiation [5], such as, the spinal cord, and the brainstem, which could be seriously affected by the radiation leading to permanent and irreversible disability. The salivary glands (parotid and submandibular glands) that their irradiation can cause a long-term dry mouth (xerostomia), which can affect the patient's dentition.
The risk for these organs is a long-term side effect, so they are considered in the planning the treatment to spared them as much as possible. So, the big problem with radiotherapy is to preserve healthy tissue while destroying cancerous tissue. There are different ways to best achieve this goal.
To limit the irradiated area as much as possible, many beams are used to carry out the treatment. This is made possible with the appearance of 3D conformational radiotherapy (3DCRT) and the development of radiotherapy techniques in IMRT and VMAT [3,4]. Indeed, the tumour receives the doses deposited by all the beams, whereas the healthy tissues are a priori only crossed by a single beam and therefore receive a much lower dose [6]. This is all the truer as the number of beams used is high because the dose per beam is then all the lower. So, the contribution of 3D conformational radiotherapy with modulation of the fluence of each beam has two main advantages [5]. On the one hand, it makes it possible to sculpt isodoses of complex shape which can be conform to the tumours whatever its shape, which makes it possible to spare OAR even better. In addition, the modulation of fluence makes it possible to deliver a homogeneous dose to the tumours.
Hence, the interest in the treatment of prostate cancer by new techniques such as IMRT and VMAT. These allow better treatment in a shorter time, a dose limited to OARs and good precision at the tumours level [7].
This study is focus on the analysis, explanation, and comparison of the different techniques of external beam radiation therapy. The aim is to compare the Volumetric Modulated Arc Therapy (VMAT) technique and the IMRT technique: Step and Shoot (SS) and Sliding Window (SW) for a series of patients treated for prostate cancer.
We choose the prostate study because it is the most frequent cancer among cancers in Morocco. Moreover, it remains at the loco regional stage for a long time and is very sensitive to radiochemotherapy.
Materials and Methods
This study was carried out on a series of 10 patients already treated with IMRT and VMAT techniques for localized prostate cancer at dose of 76 Gy in our department. The patient was placed in the supine position with a personalized restraint immobilizing the legs and feet. The target volumes and OARs were defined from images acquired on a Big Bore type scanner (Siemens) with a section thickness of 3 mm. The target volumes and the organs at risk were defined by following the recommendations of the report 62 of the International Commission on Radiation Units and Measurements (ICRU) [8] and of the Study Group on Urogenital Tumours (SGUT) [9]. Target volumes PTV76 and PTV62.7 were respectively created from the volumes CTV57 (prostate) and CTV2 (prostate+seminal vesicle) CTV3 (prostate+ seminal vesicle+lymph nodes (LT+RT+ presacres) to which a three-dimensional margin has been added. This margin was 10 mm except for the rectum where it was reduced to 5 mm. For reverse planning, target volumes were set excluding the 3 mm thick surface. The dose is administered once a day, five days a week and in 38 sessions in Integrated Boost Simultaneous Integrated Boost (SIB) [10]. The target doses on PTV are that 95% of tumour volumes should receive at least 95% of the prescribed dose and 98% of tumour volumes should receive at least 90% of the prescribed dose.
The dose is calculated by the Treatment Planning System (TPS) used in our study is Monaco version 5.11 (Algorithm: Monte Carlo Photon Grid Spacing (cm): 0.30, Statistical Uncertainty (%) per Calculation: 1.00) from Elekta company, which is based on reverse planning. These treatment ballistics using beams of photons X of 6 MV, the Photon X of 18MV is not recommended for IMRT and VMAT treatment due to neutron production, which creates the ballistics and calculates the dose distribution from the CT images. This TPS is based on reverse planning, its principle is to determine target doses, whether to organs at risk or to the area to be irradiated thanks to which an algorithm (Monte Carlo) calculation will develop the best possible ballistics according to the constraints, (PRV=OAR+ 3mm) the target volumes have been defined excluding the surface area 3 mm thick. This optimization process will make it possible to obtain modulated beams which will give a distribution as close as possible to the ideal dose distribution.
The accelerator under which we carried out this study in the radiotherapy department is Elekta Infinity dedicated to the new techniques that we have already presented. It can deliver beams of several energies in electronic mode, namely 6, 9, 12, 15 and 18 MeV and two in photon mode: 6 MV and 18 MV. It incorporates an Agility-type MLC system which has 160 blade energies 5 mm thick at the isocenter, making it possible to adapt and conform the shape of the beam to that of the tumour or of the area to be irradiated.
Equipped with an on-board XVI imaging system (CBCT) for the repositioning of the patient in three dimensions, based on the isocenter and the reference scanner sections sent from the TPS: All treatment plans were carried out by the same operator.
The 2D/3D digital verification system optimized for rotational processing techniques, works with the user-friendly and intuitive OmniPro-ImRT application software for complete verification of the plan and quality assurance of IMRT/VMAT treatments and consists of: 1020 ionization chambers, parallel reading of all ionization chambers and stand angle sensor for easy stand setup and easy alignment indicated by LEDs [11].
Dosimetric planning
Three treatment techniques were applied for each patient (SS, SW, and VMAT). The VMAT plans were optimized with the MONTE CARLO algorithm (version 5.11), using two arcs of 3600, to deliver the prescribed dose and the collimator was set to 00 with an opening which allowed finer modulations.
For the IMRT plan (SS/SW), seven equi-distributed beams have been always used with the arm angles: 207°, 258°, 309°, 0°, 51°, 102° and 153° (Figure 1), collimator angle was defined as zero for all therapeutic fields which we used for IMRT and VMAT. The doses have been designed to limit the maximum value and the same requirements for PTV and OAR coverage have been fixed for IMRT and VMAT.

Figure 1: Representation of treatment ballistics used for SS, SW and VMAT
Same constraints have been used for the three processing techniques (IMRT SS, IMRT SW, VMAT). Total number of segments of a maximum of 200, a minimum segment size of 6 cm² and 4 MU minimum per segment. All the treatment plans presented were carried out by the same operator. General plans were performed to cover at least 95% of PTV with the prescribed prescription dose, while keeping the maximum dose below 107% of the prescribed dose level limit (Table 1).
| Structure name | Cost Function | Threshold Gy | ISO Constraint |
|---|---|---|---|
| PTV76 | Target Penalty | 73 | |
| Quadratic Overdose | 77 | 0.05 | |
| PTV62.7 | Target Penalty | 60 | |
| Quadratic Overdose | 65(shrink Margin) | 0.8 | |
| PTV57 | Target Penalty | 54 | |
| Quadratic Overdose | 58.000(shrink Margin) | 0.5 | |
| Small Intestine | Serial | (shrink Margin) | 40 |
| Parallel | 30 | 40 | |
| Lt Femur | Parallel | 40 | 12 |
| Rt Femur | Parallel | 40 | 12 |
| Rectum | Serial | (shrink Margin) | 50 |
| Parallel | 50 | 40 | |
| PRV Rectum | Serial | (shrink Margin) | 53 |
| Anal Canal | Parallel | 10 | 20 |
| Quadratic Overdose | 20 | 0.08 | |
| Bladder | Serial | 67 | |
| Parallel | 50 | 40 | |
| Serial | (shrink Margin) | 40 | |
| Penile Bulb | Quadratic Overdose | 55 | 0.08 |
| Body | Quadratic Overdose | 72.2 | 0.02 |
| Quadratic Overdose | 63.2 (shrink Margin) | 0.09 | |
| Conformality | 0.8 |
Tab. 1. IMRT constraint properties
Dosimetric analysis for each treatment plan
Dosimetric values were calculated. These are either quantitative or qualitative clinical variables representing the usual criteria for comparing radiotherapy treatment plans and are classified them into 3 categories.
Tools related to the volume distribution of the dose
The Dose Volume Histograms (DVH) is quantitative evaluation tools used to describe the heterogeneous distribution of dose received by the irradiated volumes. The cumulative DVH represents the volume of the organ which receives a dose equal to or greater than the given dose. On the Y axis is the percentage of volume considered receiving a dose equal or greater than the corresponding dose given on the X axis, Ideal treatment plan is characterized by the fact that 100% of the volume to be treated receives 100% of the prescribed dose.
The analysis of the dose volume histogram makes it possible to compare the mean dose (Dmean), the minimum dose (Dmin) and maximum (Dmax) received by all the voxels of the organs considered.
Usual dosimetric quality index
The indices are based on the definition of the volumes, according to the formulas in Table 2.
| Index name | Formula | Objective | Description |
|---|---|---|---|
| Homogeneity index | HI = (D2% − D98%) / D50% | 0 | Difference of the maximum and minimum dose normalized by the median dose |
| Compliance index | CI = Va/ Vs | 1 | Ratio between the volume of the reference isodose and the volume of the structure of interest |
| Coverage index | CO = D95% / DR | 1 | Ratio of minimum dose to reference dose (95% of prescribed dose) |
| Target volume coverage | TCO =100 ×VSR/ VS | 100% | Ratio between the volume of the structure of interest covered by the reference isodose and the volume of the structure of interest expressed in% |
| Overlap report | OR=VSR/(VSUVR) | 1 | Ratio between the volume of the structure of interest covered by the reference isodose and the volume of the structure of interest, and the union of these two volumes |
| The number of conformations | CN = (VSR/VS)×(VSR/VR) | 1 | Ratio between the volume of the structure of interest covered by the reference isodose and the volume of the structure of interest ratio between the volume of the structure of interest covered by the reference isodose and the volume of the isodose reference |
Tab. 2. Definition of conformation indices
Statistical analysis
The purpose of the statistical tests is to check whether the observed differences are significant. An original statistical application based on two general hypotheses is considered, taking in account the null hypothesis H0: no difference and the alternative hypothesis H1: there is a difference. To perform this study, we need the following:
Population: Sample of "n" patients, with "n" as large as possible, including prostate tumor locations.
Dosimetric comparison criteria: Calculated and compared for each patient from the different treatment plans.
Statistical test to assess the statistical significance of the deviations observed at a defined risk threshold. Estimation of the deviation and the average percentage is performed with a confidence interval.
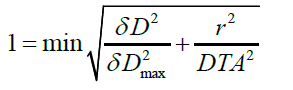
Gamma index
The Gamma index introduced to compare and evaluate the dose distribution in 2D and 3D, is defined by:
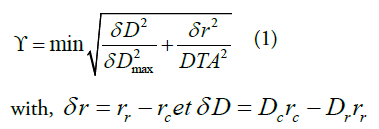
δ r is the distance between the reference point rr and the point to be evaluated rc.
δ D is the difference between the dose at point rr and that at point rc.
δ D max is the tolerance criterion for the dose (%);
DTA is the tolerance criterion for the distance (%).
For γ>1, the correspondence between the point to be evaluated and the reference point is outside the tolerance criterion and for γ <1, the correspondence between the point to be evaluated and the reference point is in the tolerance criterion. The surface which represents the tolerance criterion is an ellipsoid defined by relation.
So that the dose distribution to be evaluated can be compared to the reference dose distribution, the last one must contain at least one point inside the tolerance ellipse.
To start the treatment, the plans carried out by the percentage of the gamma index should be validated. This test was performed for a patient with prostate cancer. It was observed that the variation between the measured plane and the calculated plane by the Matrix, based on the gamma index, are superimposed with a small negligible deviation (Figure 2), (tolerance defined by the physicist 3% and 3 mm), which validates the treatment plan.

Figure 2: Patient quality control measured plan and calculated plan
Placement and treatment
To avoid different positioning deviations from the planned position of the patient image, an on-board imaging system is used. Then, the patient's position is compared to that of the patient model by comparing the images acquired before the treatment session (CBCT) with the reference one from the patient's model (image from the dosimetry scanner). This permits that the 3D images to be registered for the translation along X, Y, Z and the rotation along Rx, Ry, Rz (Figure 3).

Figure 3: Cone beam CT for the prostate
Analyses of average dose values delivered to organ at risk (oars)
These techniques made it possible to respect the prescribed constraints and the savings of the Organ at Risk (OARs) (Table 3 and Table 4). The VMAT led decreases in the average and maximum dose received by OAR. In OARs, the value of p being much greater than the significance level 0.3<p<0.99, we can therefore conclude that the dose received by OARs with the three treatment plans did not differ significantly.
| Techniques | SS | SW | VMAT |  |
 |
 |
p-value |
|---|---|---|---|---|---|---|---|
| PTV 70 | |||||||
| D98% (Gy) | 70.09 ± 1.18 | 70.25 ± 1.00 | 70.17 ± 1.67 | 0.70% | 0.03% | 0.7% | 0.266 |
| D2% (Gy) | 78.31 ± 0.328 | 77.3 ± 0.235 | 77. 25 ± 0.269 | -1.20% | -0.20% | -1% | 0.772 |
| Dmean% (Gy) | 75.14 ± 1.048 | 75.02 ± 0.327 | 75.49 ± 0.588 | 1.90% | 0.7% | 1.30% | 0.219 |
| PTV62.7 | |||||||
| D98% (Gy) | 62.23 ± 2.425 | 62.17 ± 1.063 | 62.26 ± 1.353 | 3.20% | -0.20% | 3.3% | 0.219 |
| D2% (Gy) | 77.11 ± 2.147 | 76.34 ± 1.549 | 76.27 ± 1.73 | 0.90% | -0.50% | 1.40% | 0.935 |
| Dmean % (Gy) | 73.16 ± 2.783 | 73.71 ± 1.583 | 73.02 ± 1.832 | 2.9% | 0.50% | 2.40% | 0.671 |
| PTV56 | |||||||
| D2% (Gy) | 63.78 ± 1.522 | 62.78 ± 0.463 | 62.36 ± 0.864 | 1.10% | -0.80% | 1.7% | 0.1436 |
| D98% (Gy) | 60.46 ± 3.563 | 60.72 ± 3.743 | 60.63 ± 3.773 | 1.9% | -0.10% | 2% | 0.9987 |
| Dmean (Gy) | 57 ± 1.665 | 57.21 ± 1.43 | 57.02 ± 1.594 | 0.04% | -0.33% | 0.4% | 0.8393 |
Tab. 3. Dosimetric comparison, between plans made using SS, SW and VMAT techniques, average values of the doses received by the target volumes obtained at three dose levels (SIB)
| OAR\Techniques | VMAT | SW | SS | p-value |
|---|---|---|---|---|
| Small Intestine | ||||
| V30Gy(%) | 20.13 ± 4.403 | 21.57 ± 4.932 | 21.52 ± 4.884 | 0.715 |
| V50(Gy) | 3.17 ± 1.429 | 2.58 ± 1.601 | 2.6 ± 1.887 | 0.7967 |
| Dmean (Gy) | 17.85 ± 2375 | 17.32 ± 3.143 | 17.01 ± 2.77 | 0.9771 |
| Lt Femur | ||||
| V50Gy) | 0.17 ± 1.429 | 0.58 ± 1.601 | 0.6 ± 1.887 | 0.7967 |
| Dmean(Gy) | 16.85 ± 2375 | 15.32 ± 3.143 | 15.01 ± 2.77 | 0.9771 |
| Rt Femur | ||||
| V50Gy) | 0.89 ± 7.524 | 0.92 ± 1.992 | 0.19 ± 1.899 | 0.352 |
| Dmean(Gy) | 15.16 ± 6,29 | 14.64 ± 4.243 | 14.05 ± 2.027 | 0.665 |
| Rectum | ||||
| Dmean(Gy) | 25.17 ± 3.7 | 25.61 ± 3.669 | 23.42 ± 3.373 | 0.901 |
| V 60 (Gy) (%) | 22.14 ± 8.11 | 21.85 ±8.05 | 23.27 ± 8.08 | 0.952 |
| V70Gy(%) | 7.84 ± 2.24 | 8.2 ± 3.553 | 8.56 ± 2.545 | 0.822 |
| V74Gy(%) | 1.13 ± 1,403 | 1.57 ± 1.932 | 1.52 ± 1.884 | 0.715 |
| PRV Rectum | ||||
| Dmean(Gy) | 16.38 ± 2,438 | 16.53 ± 2877 | 13.72 ± 2.424 | 0.523 |
| Anal Canal | ||||
| Dmean(Gy) | 4.17 ± 3.55 | 4.11 ± 3.669 | 4.62 ± 3.373 | 0.901 |
| Bladder | ||||
| V60 (Gy) | 12.92 ± 2.386 | 13.16 ± 2.484 | 12.08 ± 3.757 | 0.995 |
| V70(Gy) | 7.17 ± 9.48 | 7.38 ± 8.82 | 8.05 ± 8.213 | 0.997 |
| Penile Bulb | ||||
| Dmean(Gy) | 30.92 ± 2.386 | 31.16 ± 2.484 | 31.08 ± 7.757 | 0.995 |
Tab. 4. Dosimetric comparison, between plans made in SS, SW and VMAT techniques, average values of the doses received by the organs at risk obtained at three dose levels (SIB)
Results
Analyses of the average values of doses delivered at target volumes
The quantitative analysis of the dose distributions is summarized in Figure 4. Table 3 shows that these three techniques offer very good dosimetric results which allow good coverage in the three PTVs. The differences noted on the volume receiving 30% of the dose For Penile Bulb and on the maximum dose are low. To analyze these results, statistical tests were carried out on dose ranges and specific dose points which appeared interesting regarding the HDV curves (Figure 5 and 6). The dosimetries have been analyzed on Graph Pad Prism 7 version 7.04.

Figure 4: Distribution of the dose in a coronal and sagittal plane obtained in SS, SW and VMAT for a typical patient treated for cancer of the Prostate. PTVs with prescription doses of 57 Gy, 62.7 Gy and 76 Gy are shown in blue, green and sky blue, respectively

Figure 5: HDV obtained in SS (broken line), SW (thin broken line) and VMAT (continuous line) technique

Figure 6: HDV obtained in S&S (broken line), SW (thin broken line) and VMAT (continuous line) technique for risky organs
Depending on the volumes analysed, dosimetric indices were compared. The SS, SW and VAMT designs were compared using a paired ANNOVA test, with a cut off for a statistically significant level at p<<0.05. On PTV, the value of p being much greater than the significance level 0.05 (therefore retains the null hypothesis) 0.1 <p<0.99. The dose distribution in the three treatment plans do not therefore differ significantly.
Analysis of the mean values of the dosimetric indices
To dosimetrically analyse our treatment plans, we have recourse to the (Table 5) conformation indices which permit a geometric analysis, of the dose distribution, and can facilitate the dosimetry one. A statistical analysis was performed, using the p-value test to compare the difference between the modalities used. Knowing that the ideal value of the homogeneity index is 0.100% for the coverage of the target, and 1 for the other indices, the analysis of our results was based on these objectives.
| SS | SW | VMAT | p-value | |
|---|---|---|---|---|
| PTV 76 | ||||
| Homogeneity index | 0.168 | 0.109 | 0.119 | 0.2144 |
| Compliance index | 0.765 | 0.857 | 0.907 | 0.5451 |
| Coverage index | 0.937 | 1.01 | 0.975 | 0.2216 |
| Target coverage% | 88.179 | 91.175 | 93.873 | 0.7089 |
| The number of conformations | 0.894 | 0.924 | 0,954 | 0,9381 |
| Overlap ratio | 0.914 | 0.954 | 0.964 | 0.7829 |
| PTV 62.7 | ||||
| Homogeneity index | 0.2O7 | 0.106 | 0.117 | 0.0614 |
| Compliance index | 0.877 | 0.895 | 0.937 | 0.9937 |
| Coverage index | 0.967 | 0.974 | 0.984 | 0.0703 |
| Target coverage% | 90.875 | 96.344 | 97.246 | 0.6139 |
| The number of conformations | 0.83 | 1.202 | 1.079 | 0.4301 |
| Overlap ratio | 0.920 | 0.961 | 0.969 | 0.53339 |
| PTV 57 | ||||
| Homogeneity index | 0.26 | 0.106 | 0.112 | 0.7131 |
| Compliance index | 0.852 | 0.875 | 0.912 | 0.9459 |
| Coverage index | 0.971 | 0.98 | 0.989 | 0.185 |
| Target coverage% | 89.124 | 96.107 | 97.738 | 0.2641 |
| The number of conformations | 1.26 | 1.094 | 1.026 | 0.983 |
Tab. 5. Dosimetric indices calculated on plans made using SS, SW and VMAT techniques, average values obtained on 10 patients treated at three dose levels (SIB)
• The homogeneity index was close to the ideal value for the three PTV with the SW technique than with the SS and VMAT techniques, with a p-value between 0.06 and 0.71.
• The compliance index was more compliant in VMAT for the last two PTV, and in SW for the first PTV, and 0.54 <p<0.99.
• The coverage index was very close to the ideal value for the three technologies. The SW technique covers the PTV 76 and PTV 57 well, and PTV 62.7 in VMAT; with the p-value between 0.07 and 0.22.
• most of the time the conformation indices are more in conformity with the objectives and the ideal values in SW than in SS and in VMAT. These new techniques require very precise control of the geometric position of the patient by on-board imaging before the irradiation session so as not to degrade tumour coverage.
Discussion
The techniques SS, SW and VMAT, implemented respectively in our study show very satisfactory dose distributions in the event of a high dose delivered to the prostate (76Gy), in accordance with the recommendations of the GETUG group.
The analysis of particular points of the dose volume histogram, corresponding to national and international recommendations (GETUG, ICRU), associated with the analysis by dose range of the HDV, seems interesting to us to justify the relevance or not of certain dosimetric deviations.
In fact, for the PTV76, the volume receiving 76 Gy is greater in VMAT but not significant. This allows us to conclude that the VMAT makes it possible to cover the target volume in a more homogeneous way. In addition, this is accompanied by a decrease in the dose in OARs mainly for the bulb, the femoral heads and to a lesser extent for the rectum and small intestine. These results are close to those of several studies carried out by Palma, et al. [13], by Zhang, at al. [14] or by Kjaer-Kristoffersen et al. [15], who compare VMAT to SW-type RCMI techniques. Palma, et al. [13] show that for the VMAT technique, compared to the SW technique, with a dose prescription for the prostate alone of 76 Gy: the rectum volumes receiving 20 Gy and 70 Gy decrease significantly by 8% and 7% respectively, the bladder volumes receiving 20 Gy and 40 Gy do not vary significantly and the volume of the femoral head receiving 40 Gy significantly decreases by 83% [13].
In the studies by Zhang, et al. and Kjaer-Kristoffersen, et al. type SW IMRT tends to provide larger doses of PTV compared to VMAT [14, 15]. However, the differences are very small, around 1 Gy for the mean dose and the dose received by 95% of the volume or 1% for the volume receiving 95% of the dose for the data noted by Zhang, at al. [14] In addition, the VMAT technique allows better sparing of healthy organs. The conformation indexes obtained in VMAT are all closer to the ideal value, than those obtained in SS. In their study, Palma, et al. Obtained the same value of the conformation index IC for the VMAT and the SW technique, while we observe an improvement of 8.3% of the index IC when comparing the VMAT to the SS [13]. These elements of comparison are subjected to the implementation performance of the different techniques. The VMAT technique offers a major time saving, reduction of more than 50%, for the delivery of the dose to the patient. This time saving, also reported in the literature [14-18], can result in a major clinical benefit: the decrease in prostate movement during the session (intra-fraction) and therefore an improvement in tumor targeting.
In our study, the VMAT technique delivers almost 10% less MU compared to the modulation of intensity by static beams type SS and SW. Palma et al., Zhang, et al. and Kjaer-Kristoffersen et al. Observe a decrease of between 22% and 55% in the number of MUs with the VMAT technique compared to a SW technique in the case of prostate cancer [13,15]. There is a reason why our results differ significantly from those of these studies. This is because the SW technique delivers 15% to 50% more MU than the SS technique depending on the method used [19,20]. The increase in the number of MUs in intensity modulation techniques contributes to the increase in the integral dose received by the patient, in particular outside the irradiation field [21, 22]. However, the dose received outside the irradiation field increases the risk of a second cancer [23,24]. In addition, the VMAT technique increases the volume of healthy tissue in the irradiated irradiation field at a low dose level compared to the SW and SS techniques, just as RCMI increases it compared to an 3DCRT technique without modulation intensity [25].
In our study the results are similar to the results found by Zhang, et al. [14]. The problem in terms of saving healthy tissue therefore amounts to making a compromise between reducing the high doses in OARs and increase low doses delivered in large volumes of healthy tissue. In our study we evaluated the capacity of VMAT to deliver a heterogeneous dose to the target prostate volume, in a concept of “dose-tumor painting”. The VMAT technique allows a dose escalation on the PTV higher by 0.95% on average compared to IMRT SS AND IMRT SW. These results are in agreement with the study by Shaffer, et al. [26] which show the ability of VMAT to irradiate a greater proportion of high-dose CTV in an intraprostatic dose escalation technique compared to a SW technique. These features of VMAT become particularly interesting when considering a hypo fractionated irradiation regimen for prostate adenocarcinomas due to an adapted biological rationale [14,27,28]. The VMAT technique constitutes an improvement of existing intensity modulation techniques on the sole condition that the quality of its implementation is optimal and in particular in terms of calculation-measurement consistency.
Theo, et al. who carried out a state of the art of the clinical use of VMAT and in particular for the prostate [29]. They provided a synthesis of the results of numerous studies published between 2009 and 2011 [13,15,18,26,30-32]. One of the conclusions common to the studies presented is the reduction in treatment delivery time, which goes on average from 5 min-10 min in IMRT to 5 or 7 stationary beams to 1 min-1.5 min in VMAT. This reduction in treatment time can be essential in the prostate, which encourages the placement of VMAT in this clinical case.
Conclusion
Radiotherapy technology has undergone rapid development in recent years, thus allowing ease and more precision in treatment techniques. Indeed, the appearance of IMRT and the birth of VMAT allow a concave dose distribution, perfectly suited to the irradiation of prostate cancers, which is the clinical justification for this work, and which requires special attention. given its frequent incidence.
In the case of prostate irradiation, the VMAT technique constitutes an improvement in intensity modulation irradiation techniques due to a reduction compared to the SS and SW techniques. The dose delivered to the OARs, in particular reduction of the average doses received by the rectum and the femoral heads of 1.3 Gy and 7.0 Gy respectively, of the time of realization of the irradiation of 50% and of the number of monitor units required by 7%. Regarding calculationmeasurement consistency, the two techniques, SS and VMAT, meet the criteria of having at least 95% of accepted points and an average gamma of less than 0.5 in the 3% gamma index test (local dose)/3 mm in isodose.
This survey aims to shed light on the contribution of IMRT (SS and SW) and VMAT techniques in the treatment of prostate cancer, as well as their role in the preservation of these organs at risk respectively. The calculation revealed that the dosimetric indices were in line with the objectives and close to ideal values, which illustrates that the treatment plans used were as satisfactory as possible. For the statistical study based on the p-value, it was found that it retained the null hypothesis, and that the dose distribution and indices between the three treatment plans did not differ significantly.
Thus, there is no ideal technique; there are techniques available to treat different types of tumor within a radiotherapy platform. It is necessary to systematically analyze the situation, the target region, the neighboring organs, to determine the most suitable technique. Finally, the most suitable technique is the technique most mastered and experienced by the doctor-physicist couple.
References
- Cornu JN, Doucet C, Sèbe P, Ciofu C, Gil Diez de Medina S, et al. Prospective evaluation of intrasphincteric injections of autologous muscular cells in patients with stress urinary incontinence following radical prostatectomy. Prog Urol. 2011;21:859-865.
- Servagi-Vernat S. Université de Franche-Comté. 2017.
- Eldebawy E, Rashed Y, AlKhaldi M, Day E. A Dosimetric Comparison of Volumetric-Modulated Arc Therapy to Intensity-Modulated Radiation Therapy in the Treatment of Locally Advanced Rectal Carcinoma. Iran J Med Phys. 2020;17:374-379.
- Singh HB, Gandhi A, Sapru S, Khurana R, Hadi, et al. Comparison of Volumetric Modulated Arc Therapy and Three-Dimensional Conformal Radiotherapy in Postoperative High-Grade Glioma: A Dosimetric Comparison. , Iran J Med Phys. 2019;16: 385-391.
- Ramus L Conception et utilisation d'atlas anatomiques pour la segmentation automatique: application à la radiothérapie des cancers ORL. 2011.
- Sanda C. Advantages of VMAT-IMRT technique in nasopharyngeal cancer. Rhinol. Suppl. 2016;6.
- Manuel de l'exploitant SOMATOM Definition AS SIEMENS.
- Chavaudra J, Bridier A, Definition of volumes in external radiotherapy. Cancer radiotherapie. 2001;5:472-478.
- Beckendorf V, Guerif S, Prise EL, Cosset JM, Salem M, et al. The GETUG 70 Gy vs. 80 Gy randomized trial for localized prostate cancer: Feasibility and acute toxicity. Int J Radiat Oncol Biol Phys. 2011;80:1056-1063.
- Jothybaso KS, Bahal H, Subramani V, Rath K, Sharma DN, et al. Static versus dynamic intensity-modulated radiotherapy: Profile of integral dose in carcinoma of the nasopharynx. J Med Phys. 2009;34:66-72.
- Guide Manuel Système MatriXX Evolution IBA.
- Ortholan C, Estivalet S, Barillot I, Costa A, Gérard JP. Guide for external beam radiotherapy. Procedures 2007. Cancer Radiother. 2007;6:329-330.
- Palma D, Vollans E, James K, Nakano S, Moiseenko V, et al. Volumetric Modulated Arc Therapy for Delivery of Prostate Radiotherapy: Comparison With Intensity-Modulated Radiotherapy and Three-Dimensional Conformal Radiotherapy. Int. J. Radiat. Oncol. Biol. Phys. 2008;72: 996-1001.
- Zhang P, Happersett L, Hunt M, Jackson A, Zelefsky M, et al. Volumetric modulated arc therapy: planning and evaluation for prostate cancer cases. Int. J. Radiat. Oncol. Biol. Phys. 2010; 76: 1456-1462.
- Kjaer-Kristoffersen F, Ohlhues L, Medin J, Korreman S. RapidArc volumetric modulated therapy planning for prostate cancer patients Acta Oncol ACTA ONCOL. 2009;48: 227-232.
- Otto K. Volumetric modulated arc therapy. J. Med. Phys.2008; 35: 310-317.
- Vanetti E, Clivio A, Nicolini G, Fogliata A, Ghosh-Laskar S, et al. Volumetric modulated arc radiotherapy for carcinomas of the oro-pharynx, hypo-pharynx and larynx: A treatment planning comparison with fixed field IMRT. Radiother Oncol. 2009;92:111-117.
- Guckenberger M, Richter A, Krieger T, Wilbert J, Baier K, et al. Is a single arc sufficient in volumetric-modulated arc therapy (VMAT) for complex-shaped target volumes. Radiother Oncol. 2009;93:259-265
- Alaei P, Higgins PD, Weaver R, Nguyen N. Comparison of dynamic and step-and-shoot intensity-modulated radiation therapy planning and delivery. Med Dosim. 2004 ;29:1-6.
- Chui CS, Chan MF, Yorke E, Spirou S, Ling CC. Delivery of intensity-modulated radiation therapy with a conventional multileaf collimator: Comparison of dynamic and segmental methods. J. Med. Phys. 2001;28:2441-2449.
- Kry SF, Salehpour M, Followill DS, Stovall M, Kuban DA,et al. Out-of-field photon and neutron dose equivalents from step-and-shoot intensity-modulated radiation therapy. Int. J. Radiat. Oncol. Biol. Phys. 2005;62:1204-1216.
- Verellen D, Vanhavere F. Risk assessment of radiation-induced malignancies based on whole-body equivalent dose estimates for IMRT treatment in the head and neck region.Radiother Oncol. 1999;53:199-203.
- Kry SF, Salehpour M, Followill DS, Stovall M, Kuban DA,et al. The calculated risk of fatal secondary malignancies from intensity-modulated radiation therapy. Int. J. Radiat. Oncol. Biol. Phys. 2005 ;62:1195-1203.
- Kry SF, Followill D, White RA, Stovall M, Kuban DA,et al. Uncertainty of calculated risk estimates for secondary malignancies after radiotherapy. Int. J. Radiat. Oncol. Biol. Phys.2007;68:1265-1271.
- Zietman AL, DeSilvio ML, Slater JD, Rossi CJ, Miller DW,et al. Comparison of conventional-dose vs high-dose conformal radiation therapy in clinically localized adenocarcinoma of the prostate: a randomized controlled trial. Jama.2005;294:1233-1239.
- Shaffer R, Morris WJ, Moiseenko V, Welsh M, Crumley C,et al. Volumetric modulated Arc therapy and conventional intensity-modulated radiotherapy for simultaneous maximal intraprostatic boost: a planning comparison study. Clin. Oncol.2009;2009:401-407.
- Brenner DJ, Martinez AA, Edmundson GK, Mitchell C, Thames HD,et al. Direct evidence that prostate tumors show high sensitivity to fractionation (low α/β ratio), similar to late-responding normal tissue. Int J Radiat Oncol Biol Phys. 2002;52:6-13.
- Bentzen SM, Ritter MA. The alpha/beta ratio for prostate cancer: what is it, really? Radiother Oncol. 2005;76:1-3.
- Teoh M, Clark CH, Wood K, Whitaker S, Nisbet A. Volumetric modulated arc therapy: a review of current literature and clinical use in practice. Brit J Radiol.2011;84:967-996.
- Speleers B, Meerleer GD, Ost P, Neve WD, Fonteyne V, et al. Volumetric arc therapy and intensity-modulated radiotherapy for primary prostate radiotherapy with simultaneous integrated boost to intraprostatic lesion with 6 and 18 MV: a planning comparison study. Int J Radiat Oncol Biol Phys. 2010;79:920-926.
- Hardcastle N, Tomé WA, Foo K, Miller A, Carolan M,et al. Comparison of prostate IMRT and VMAT biologically optimised treatment plans. Med Dosim.2011;36:292-298
- Van den Heuvel F, Defraene G, Crijns W, Bogaerts R. Out-of-field contributions for IMRT and volumetric modulated arc therapy measured using gafchromic films and compared to calculations using a superposition/convolution based treatment planning system. Radiother Oncol.2012;105:127-132


