Research Article - Onkologia i Radioterapia ( 2022) Volume 0, Issue 0
Dataset size sensitivity analysis of machine learning classifiers to differentiate molecular markers of paediatric low-grade gliomas based on MRI
Matthias W. Wagner1*, Khashayar Namdar1, Abdullah Alqabbani1, Nicolin Hainc1,2, Liana Nobre Figuereido3, Min Sheng1, Manohar M Shroff1, Eric Bouffet3, Uri Tabori3, Cynthia Hawkins4, Michael Zhang5, Kristen W. Yeom5, Farzad Khalvati1 and Birgit B. Ertl-Wagner12Department of Neuroradiology, University of Zurich, Zurich, Switzerland
3Department of Neurooncology, University of Toronto, Toronto, Canada
4Department of Paediatric Laboratory Medicine, University of Toronto, Toronto, Canada
5Department of Radiology, Stanford University School of Medicine, Stanford.California, United States
Matthias W. Wagner, Department of Diagnostic and Medical Imaging, University of Toronto, ADDRESS: 555 University Ave, Toronto, ON M5G 1X8, Canada, Canada, Email: m.w.wagner@me.com
Received: 18-Apr-2022, Manuscript No. OAR-22-61085; , Pre QC No. OAR-22-61085 (PQ); Editor assigned: 20-Apr-2022, Pre QC No. OAR-22-61085 (PQ); Reviewed: 25-Apr-2022, QC No. OAR-22-61085; Revised: 27-Apr-2022, Manuscript No. OAR-22-61085 (R); Published: 04-May-2022, DOI: 10.4172/1896-8961.16.S1.002
Abstract
Objectives: BRAF status has important implications for prognosis and therapy of Pediatric Low-Grade Gliomas (pLGG). Machine Learning (ML) approaches can predict BRAF status of pLGG on pre-therapeutic brain MRI, but the impact of training data sample size and type of ML model is not established.
Methods: In this bi-institutional retrospective study, 251 pLGG FLAIR MRI datasets from 2 children’s hospitals were included. Radiomics features were extracted from tumor segmentations and five models (Random Forest, XGBoost, Neural Network (NN) 1 (100:20:2), NN2 (50:10:2), NN3 (50:20:10:2)) were tested to classify them. Classifiers were cross-validated on data from institution 1 and validated on data from institution 2. Starting with 10% of the training data, models were cross-validated using a 4-fold approach at every step with an additional 2.25% increase in sample size.
Results: Two-hundred-twenty patients (mean age 8.53 ± 4.94 years, 114 males, 67% BRAF fusion) were included in the training dataset and 31 patients (mean age 7.97 ± 6.20 years, 18 males, 77% BRAF fusion) in the independent dataset. NN1 (100:20:2) yielded the highest area under the receiver operating characteristic curve (AUC). It predicted BRAF status with a mean AUC of 0.85, 95% CI (0.83, 0.87) using 60% of the training data and with mean AUC of 0.83, 95% CI (0.82, 0.84) on the independent validation data set.
Conclusion: Neural nets have the highest AUC to predict BRAF status compared to Random Forest and XG Boost. The highest AUC for training and independent data was reached at 60% of the training population (132 patients).
Keywords
HRandom forest, neural net, xgboost, radiomics, chemotherapy
Introduction
Pediatric Low-Grade Gliomas (pLGG) comprise a heterogeneous variety of tumors classified by the World Health Organization as grades I or II [1,2]. They are the most common brain tumors in children, accounting for approximately 40% of tumors of the Central Nervous System (CNS) in childhood [3]. If total resection is not possible, pLGG become a chronic disease with protracted reduction in quality of life [1,4] with a 10-year Progression-Free Survival (PFS) of less than 50% [5,6]. Molecular characterization of sporadic pLGG has identified frequent alterations in the RAS-MAPK pathway, most commonly fusions or mutations in the BRAF gene [7,8]. Lassaletta et al. recently showed that patient prognosis differs based on the underlying molecular alteration: pLGG with BRAF fusion have a favorable outcome, while those with BRAF V600E mutation are at increased risk of progression and transformation [9,10]. This has led to clinical trials using RAS-MAPK pathway targeted agents such as MEK inhibitors and BRAF V600E inhibitors for patients with molecular evidence of BRAF alterations. These new therapies are promising and many pLGG that were refractory to traditional chemotherapy have had significant responses [11,12].
In the past decade, radiomics has emerged as an imaging-based method to link quantitative features extracted from medical images to outcomes, such as cancer genotype or survival [13,14]. Radiomic signatures have been extensively investigated for different cancer sites including liver cancer [15], bone tumors [16], glioblastoma [17], medulloblastoma, and midline high-grade glioma [18,19]. Recently, we applied Random Forest (RF) to differentiate BRAF fused from BRAF V600E mutated pLGG and yielded an Area Under the receiver operating characteristic Curve (AUC) of 0.85 on an independent validation set [20]. It has not been well established to what extent different classification models and the size of the training data affects diagnostic performance. This may also serve as a model for classification algorithms in other tumors.
We therefore aimed to assess the performance of five commonly used Machine Learning (ML) models to predict BRAF fusion or BRAF V600E mutation on an independent validation set with systematic step-wise increase of training data.
Materials and Methods
Patients
This retrospective study was approved by the institutional review board or research ethics board of the two participating academic institutions: The Hospital for Sick Children (Toronto, Ontario, Canada) and The Lucile Packard Children’s Hospital (Stanford University, Palo Alto, California). This study was performed in accordance with the relevant guidelines and regulations. Informed consent was waived by the local institutional review or research ethics boards due to the retrospective nature of the study. An inter-institutional data transfer agreement was obtained for data-sharing. Patients were identified from the electronic health record data bases at Toronto from January 2000 to December 2018 and at Stanford from January 2009 to January 2016. Patient inclusion criteria were: 1) age 0–18 years, 2) availability of molecular information on BRAF status in histopathologically confirmed pLGG, and 3) availability of preoperative brain MRI with a non-motion degraded FLAIR sequence. Patients with histone H3 K27M mutation and neurofi- bromatosis 1 were excluded. Spinal cord tumors were also excluded.
The datasets of 94 patients from The Hospital for Sick Children, Toronto, and 21 patients from The Lucile Packard Children’s Hospital, Stanford, used in this study have been previously published [20]. The previous study applied an RF model without variations in sample size to differentiate BRAF fused from BRAF V600E mutated pLGG. Our current study investigates the performance of five commonly used ML models and various sample sizes to predict BRAF fusion or BRAF V600E mutation on an independent validation set using a systematic step-wise increase of training data.
Molecular analysis
BRAF fusion status was determined using a nanoString panel or Fluorescence In Situ Hybridisation (FISH) while BRAF p.V600E mutation was determined using immunohistochemistry or droplet digital PCR as previously described [21].
MRI acquisition, data retrieval, image segmentation: All patients from The Hospital for Sick Children, Toronto, underwent brain MRI at 1.5 T or 3 T across various vendors (Signa, GE Healthcare; Achieva, Philips Healthcare; Magnetom Skyra, Siemens Healthineers). Sequences und segmentations details are provided in the Supplemental Methods.
Radiomic feature-extraction methodology
A total of 851 MRI-based radiomic features were extracted from the ROIs on FLAIR images. Radiomic features included histogram, shape, and texture features with and without wavelet-based filters. Features of Laplacian of Gaussian filters were not extracted. All features are summarized in Supplemental Table. Bias field corrections prior to z-score normalization were used to standardize the range of all image features [22,23]. Once the features were extracted, we applied z-score normalization again followed by L2 normalization to the features of cohort 1 and used the distribution of the features in cohort 1 (training data) to normalize cohort 2 (validation data). Details of pre-processing and radiomic feature extraction in 3D Slicer have been described elsewhere [13,17,24].
Statistical and ML analysis
We used t-distributed Stochastic Neighbor Embedding (t-SNE) to visualize our dataset. RF, XGBoost, NN1 (100:20:2), NN2 (50:10:2), NN3 (50:20:10:2) were utilized as classification models [25-27]. Descriptions of t-SNE, RF, XGBoost, and NN and can be found in detail in the Supplemental Methods.
Internal cross validation
Starting with 10% of the training data, all models were cross-validated using a 4-fold approach with a systematic step wise 2.25% increase in sample size. At each step, experiments were repeated 10 times using randomized versions of the respective percentage of the training data, resulting in 10 classifiers per step.
External validation
At each step, the 10 classifiers were validated on the entire independent external data set. Classification performance metrics: Mean AUC and 95% Confidence Intervals (CI) were calculated for every step for both training and validation data sets, and the process was repeated for all five models. The external validation data set was never used in any stage of the training of the models and was dedicated to external validation. To examine whether the difference between performance of the models were significant, we conducted a two-sided two-sample Kolmogorov-Smirnov (KS) test on mean AUCs across training sample sizes for each pair of our models (Figure 1).

Figure 1: Neural Network architectures used for the experiments.

Results
Patients
A total of 251 children (132 males (53%), mean age 8.5 years, Standard Deviation (SD) 5.1 years) were included. The internal cohort consisted of 220 patients (114 males (52%), mean age 8.5 years, SD 4.9 years) from The Hospital for Sick Children. The external cohort consisted of 31 patients (18 males (58%), mean age 8.0 years, SD 6.2 years) from The Lucile Packard Children’s Hospital, were analyzed. BRAF fusion was found in 172 of 251 patients (69%), in 148 of 220 patients from the Toronto cohort (67%), and in 24 of 31 patients from the Stanford cohort (77%). Patient demographic information and pathologic information including age at diagnosis, sex, histologic diagnosis, and molecular diagnosis regarding BRAF status are provided in Table 1.
| Institutional cohort | Toronto | Stanford | |
|---|---|---|---|
| No. of patients | 220 | 31 | |
| Age (mean) (yr) | 8.53 | 7.97 | |
| Male sex (No.) (%) | 114 (52) | 18 (58) | |
| Histological diagnosis (No.) | JPA | 122 | 21 |
| LGA | 32 | - | |
| GG | 30 | 7 | |
| DA | 12 | - | |
| PMA | 9 | 3 | |
| PXA | 6 | - | |
| ODG | 2 | - | |
| NC | 2 | - | |
| DNET | 2 | - | |
| GC | 1 | - | |
| GNT | 1 | - | |
| Mixed | 1 | - | |
| Molecular subgroup (No.) (%) | BRAF fusion | 148 (67) | 24 (77) |
| BRAF mutation | 72 (33) | 7 (23) | |
Tab. 1. Patient demographics. (Note: JPA=Juvenile Pilocytic Astrocytoma; LGA=Low Grade Astrocytoma; GG=Ganglioglioma; DA=Diffuse Astrocytoma, PMA=Pilomyxoid Astrocytoma; PXA=Pleomorphic Xanthoastrocytoma; ODG=Oligodendroglioma; NC=Neurocytoma; DNET= Dysembryoplastic Neuroepithelial Tumor; GC=Gangliocytoma; GNT=Glioneuronal Tumor; Mixed=Mixed Histology)
Data visualization
t-SNE was used for data visualization (Figure 2). No apparent separation was found between the internal and external data set, neither for the whole data nor for the two classes. However, locality of BRAF V600E mutation examples suggests separability of the two classes.
Classification model evaluation and comparison of performance
AUC values over the entire training or external data were averaged for each model and performances were compared using two sided two-sample KS tests (Table 2). The performance of the five models over a 2.25% step wise increase of training data is shown in Figure 3. All classifiers showed a decreasing variance on the internal data with a continued increase in sample size. While the performance on the internal data was significantly higher for RF and XGBoost (p-values: all<0.0001 for RF vs. NN1/NN2/NN3 and all<0.0001 for XGBoost vs. NN1/NN2/NN3), their performance was significantly lower and their variation was higher on the external data compared to the three NNs (Figure 4) (p-values: all p<0.0001 for RF vs. NN1/NN2/NN3 and all p<0.0001 for XGBoost vs. NN1/NN2/NN3). XGBoost had a significantly different performance compared to RF on the external data (p-value:<0.0001) while demonstrating a higher variance. On the internal data, NN1 and NN2 showed similar performance, but they were significantly different from NN3 (p-value: <0.0001 for NN1 vs. NN3 and p-value: 0.016 for NN2 vs. NN3). All three NNs demonstrated similar high performance and low variance on the external cohort up until 70% of the training data, where performance dropped to the level of XGBoost and their variance increased. Mean, upper and lower confidence interval sensitivity, specificity, accuracy, and F1 score across the entire training and external validation dataset are summarized in Table 3. At 60% of the training data (132 patients), NN1 and NN2 yielded the best results on the validation data (NN1 and NN2: mean AUC with (95% Confidence Interval): 0.83 (0.82-0.84)). NN3 performed slightly below NN1 and NN2: 0.82 (0.81-0.84). RF and XGBoost AUC values at 60% were 0.72 (0.7-0.74) and 0.75 (0.72-0.78), respectively. On the training data set, RF had the highest AUC at 60%: 0.87 (0.86-0.90). XGBoost performed slightly below RF at 0.87 (0.85-0.89). NN1 and NN2 were performing at the same level: 0.85 (0.83 0.87) and NN3 was slightly below: 0.84 (0.81 0.86).
| Internal | NN1 | NN2 | NN3 | XGBoost | RF | |
|---|---|---|---|---|---|---|
| NN1 | 0.42 | <0.0001 | <0.0001 | <0.0001 | ||
| NN2 | 0.42 | 0.016 | <0.0001 | <0.0001 | ||
| NN3 | <0.0001 | 0.016 | <0.0001 | <0.0001 | ||
| XGBoost | <0.0001 | <0.0001 | <0.0001 | 0.99 | ||
| RF | <0.0001 | <0.0001 | <0.0001 | 0.99 | ||
| External | NN1 | 0.59 | 0.1 | <0.0001 | <0.0001 | |
| NN2 | 0.59 | 0.1 | <0.0001 | <0.0001 | ||
| NN3 | 0.1 | 0.1 | <0.0001 | <0.0001 | ||
| XGBoost | <0.0001 | <0.0001 | <0.0001 | <0.0001 | ||
| RF | <0.0001 | <0.0001 | <0.0001 | <0.0001 |
Tab. 2. Comparison of model performance. Two-sided two-sample Kolmogorov-Smirnov test on mean AUCs across all training sample sizes for each pair of the five models. (Note: Neural Network 1 (NN1) (100:20:2); Neural Network 2 (NN2) (50:10:2); Neural Network 3 (NN1) (50:20:10:2); Random Forest (RF); eXtreme Gradient Boost (XGBoost))
| Metric | Model | Training dataMean (CI) | Validation dataMean (CI) |
|---|---|---|---|
| Sensitivity | RF | 0.85 (0.82-0.89) | 0.71 (0.71-0.71) |
| XGB | 0.85 (0.81-0.88) | 0.69 (0.63-0.74) | |
| NN1 | 0.82 (0.79-0.85) | 0.71 (0.71-0.71) | |
| NN2 | 0.81 (0.77-0.84) | 0.71 (0.71-0.71) | |
| NN3 | 0.81 (0.77-0.84) | 0.73 (0.70-0.76) | |
| Specificity | RF | 0.87 (0.84-0.90) | 0.82 (0.79-0.85) |
| XGB | 0.85 (0.82-0.88) | 0.87 (0.84-0.90) | |
| NN1 | 0.85 (0.81-0.88) | 0.92 (0.91-0.93) | |
| NN2 | 0.85 (0.82-0.89) | 0.93 (0.92-0.94) | |
| NN3 | 0.85 (0.81-0.89) | 0.91 (0.89-0.93) | |
| Accuracy | RF | 0.86 (0.84-0.88) | 0.80 (0.77-0.82) |
| XGB | 0.85 (0.83-0.87) | 0.83 (0.81-0.85) | |
| NN1 | 0.84 (0.82-0.86) | 0.87 (0.87-0.88) | |
| NN2 | 0.84 (0.82-0.86) | 0.88 (0.87-0.89) | |
| NN3 | 0.83 (0.81-0.86) | 0.87 (0.86-0.88) | |
| F1 Score | RF | 0.81 (0.78-0.83) | 0.62 (0.59-0.64) |
| XGB | 0.79 (0.77-0.81) | 0.65 (0.62-0.67) | |
| NN1 | 0.78 (0.75-0.80) | 0.72 (0.71-0.73) | |
| NN2 | 0.77 (0.75-0.79) | 0.73 (0.72-0.75) | |
| NN3 | 0.77 (0.74-0.79) | 0.72 (0.70-0.74) |
Tab. 3. ROC related Parameters in differentiating the poorly and well/moderately differentiated groups of ESC. Mean performance metrics over entire training and validation data set.

Figure 2: tSNE Visualization of the dataset: Circles denote BRAF fusion, while plus markers represent BRAF V600E mutation. Green and grey colors highlight internal and external data, respectively. 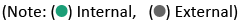

Figure 3: Area under the curve performance of different models on internal and external cohorts across training dataset sizes. A: Random Forest; B: XGBoost; C: Neural Network 1; D: Neural Network 2, E: Neural Network 3.

Figure 4: Comparison of area under the curve performance of different models across training dataset sizes.

Discussion
In this bi-institutional study, we assessed five commonly used ML classifiers to predict BRAF fusion or BRAF V600E mutation on independent data using a systematic step-wise increase of training data. Our results indicate that although classifier performance is generally high, certain classifiers can perform better than others. We found that NNs1-3 outperformed XGBoost and RF on the external data, while they demonstrated lower AUCs on the internal data. This was visible starting from >20% of the training data or 42 patients. NNs1-3 achieved a high level of performance on the external data with only a limited amount of training data. This remained at a similar level with further increase of training data. At 70% of the training data, performance levels of NNs1-3 dropped to the level of XGBoost. This effect was attributed to overfitting. NN1 and 2 (100:20:2 and 50:10:2) yielded the best AUC on the external data at 60% of the training data (AUC: 0.83). Though differences in performance in NN1-3 were not statistically significant on the external data, we observed the least variation in performance with NN1.
RF has been a popular data mining and statistical tool in radiomics research due to its transparency and success in classification and regression tasks [20, 28-31]. It generates a large number of decision trees using random subsamples of the training data while also randomly varying the features used in the trees [32]. GBT differ from RF in that they add decision trees sequentially so that errors of the previous tree are revised by the next tree. XGBoost further enhances this process by correlating the new tree with the negative gradient of the loss function associated with the whole tree assembly [33]. Accordingly and in line with a prior radiomics study on response assessment of rare cancers, XGBoost significantly increased our model’s performance compared to RF on the external data set [34].
The rationale to applying NN with different architectures was that it employs several layers possibly facilitating a higher dimensional feature selection algorithm. Similar to our results, Yun et al. [35] and Bae et al. [36] found that a NN approach using radiomics features as input outperformed other ML classifiers on external data sets differentiating brain tumor types. In the study of Yun et al., NNs fed with radiomics features significantly outperformed support vector machine, RF, generalized linear model, human readers, and CNN on external validation data [35]. The relatively low performance of CNN was attributed to the small training data set (n=123) and heterogeneity in image acquisition [35]. Using a training cohort of 166 patients with glioblastoma or brain metastasis, Bae et al. could show that deep neural networks outperform human readers and traditional ML classifiers including adaptive boosting, support vector machine, and linear discriminant analysis [36].
Our study also investigated the role of the training data sample size on model performance on the external data set. Using an incremental 2.25% increase in training data, we found the best performance of NN1 and NN2 on the external data at 60% or 132 patients. Notably, performance was high on the external data starting already at 20% of the training data, however, there was marked variation on internal cross validation. This may be explained by the heterogeneity of the training data diagnoses and the relative homogeneity of the validation set.
NN demonstrated increased performance over conventional ML classifiers [35] and CNN [35] when MRI data is limited. We therefore recommend a combination of radiomic features and NN classification as a ML classifier when data are limited.
Our study has several limitations. With the small samples, large feature sets, and low signal-to-noise that are characteristic of neuroimaging data, prediction models built using neuroimaging data are at a high risk of overfitting [37]. We experienced overfitting of NN1-3 at 70% of the training data. Due to the retrospective and bi-institutional nature of our study, there were heterogeneous FLAIR sequence acquisitions, various scanner vendors, and different field strengths in our sample. Given that this heterogeneity reflects clinical practice, a reliable model should incorporate these technical variations. For our study, we only used FLAIR images. Incorporating additional MR imaging sequences such as T2-weighted images, DWI, and contrast-enhanced T1-weighted sequences could further increase model performance.
Conclusion
A combination of radiomic features and NN led to a high performing and reliable model for the challenging classification task of differentiating the molecular status of pediatric low grade glioma based on MRI data. The model was superior to RF and XGB for small datasets. This may have implications for the classification of other tumors with limited sample sizes as well.
Acknowledgements
MWW, KN, AA, NH, FK, LN, MS, MMS, EB, UT, MZ, KWW, FK, BEW received no grant for this study from any funding agency in the public, commercial or not-for-profit sectors.
CH: Canadian Cancer Society (Grant # 706160); Canadian Institute of Health Research (Grant # 159805).
References
- Sturm D, Pfister SM, Jones DT. Pediatric gliomas: current concepts on diagnosis, biology, and clinical management. J Clin Oncol. 2017;35:2370-2377.
[Crossref][Google scholar][Pubmed]
- Goebel A-M, Gnekow AK, Kandels D, et al. Natural History of Pediatric Low-Grade Glioma Disease-First Multi-State Model Analysis. J Cancer. 2019;106314-6326.
- Ostrom QT, Gittleman H, Liao P, et al. CBTRUS statistical report: primary brain and other central nervous system tumors diagnosed in the United States in 2010–2014. Neuro-oncology. 2017;19:v1-v88.
- Armstrong GT, Conklin HM, Huang S, et al. Survival and long-term health and cognitive outcomes after low-grade glioma. Neuro-oncology. 2011;13:223-234.
- Lassaletta A, Scheinemann K, Zelcer SM, et al. Phase II weekly vinblastine for chemotherapy-naive children with progressive low-grade glioma: a canadian pediatric brain tumor consortium study. J Clin Oncol. 2016;34:3537-3543.
- Krishnatry R, Zhukova N, et al. Clinical and treatment factors determining long‐term outcomes for adult survivors of childhood low‐grade glioma: A population‐based study. Cancer. 2016;122:1261-1269.
- AlRayahi J, Zapotocky M, Ramaswamy V, et al. Pediatric brain tumor genetics: what radiologists need to know. Radiographics. 2018;38:2102-2122.
- Ryall S, Tabori U, Hawkins C. Pediatric low-grade glioma in the era of molecular diagnostics. Acta Neuropathologica Communications. 2020;8:30.
- Lassaletta A, Zapotocky M, Mistry M, et al. Therapeutic and prognostic implications of BRAF V600E in pediatric low-grade gliomas. J Clin Oncol. 2017;35:2934.
- Mistry M, Zhukova N, Merico D, et al. BRAF mutation and CDKN2A deletion define a clinically distinct subgroup of childhood secondary high-grade glioma. J Clin Oncol. 2015;33:1015.
- Fangusaro J, Onar-Thomas A, Poussaint TY, et al. LGG-08. A phase ii prospective study of selumetinib in children with recurrent or refractory Low-Grade Glioma (lgg): a Pediatric Brain Tumor Consortium (pbtc) study. Neuro-oncology. 2017;19:iv34-iv5.
- Hargrave DR, Bouffet E, Tabori U, et al. Efficacy and safety of dabrafenib in pediatric patients with braf v600 mutation–positive relapsed or refractory low-grade glioma: results from a phase i/iia study. Clinical Cancer Research. 2019;25:7303-7311.
- Aerts HJ, Velazquez ER, Leijenaar RT, et al. Decoding tumour phenotype by noninvasive imaging using a quantitative radiomics approach. Nat Commun. 2014;5:4006.
- Khalvati F, Zhang Y, Wong A, et al. Radiomics. 2019.
- Stocker D, Marquez HP, Wagner MW, et al. MRI texture analysis for differentiation of malignant and benign hepatocellular tumors in the non-cirrhotic liver. Heliyon. 2018;4:e00987.
- Fritz B, Müller DA, Sutter R, et al. Magnetic resonance imaging–based grading of cartilaginous bone tumors: added value of quantitative texture analysis. Investigative radiology. 2018;53:663-672.
- Chaddad A, Kucharczyk MJ, Daniel P, et al. Radiomics in glioblastoma: current status and challenges facing clinical implementation. Frontiers in oncology. 2019;9.
- Iv M, Zhou M, Shpanskaya K, et al. MR imaging-based radiomic signatures of distinct molecular subgroups of medulloblastoma. AJNR Am J Neuroradiol. 2019;40:154-161.
- Goya-Outi J, Calmon R, Orlhac F, et al. Can structural mri radiomics predict dipg histone h3 mutation and patient overall survival at diagnosis time?. International conference on Biomedical & Health Informatics (BHI). 2019:
- Wagner MW, Hainc N, Khalvati F, et al. Radiomics of pediatric low-grade gliomas: toward a pretherapeutic differentiation of braf-mutated and braf-fused tumors. AJNR Am J Neuroradiol. 2021.
- Ryall S, Zapotocky M, Fukuoka K, et al. Integrated molecular and clinical analysis of 1,000 pediatric low-grade gliomas. Cancer Cell. 2020;37:569-83.e5.
- Tustison NJ, Avants BB, Cook PA, et al. N4ITK: improved N3 bias correction. IEEE Trans Med Imaging. 2010;29:1310-1320.
- Li J, Liu S, Qin Y, et al. High-order radiomics features based on T2 FLAIR MRI predict multiple glioma immunohistochemical features: A more precise and personalized gliomas management. PLoS One. 2020;15:e0227703.
- Park JE, Kim HS. Radiomics as a quantitative imaging biomarker: practical considerations and the current standpoint in neuro-oncologic studies. Nucl Med Mol Imaging. 2018;52:99-108.
- Breiman L. Bagging predictors. Machine learning. 1996;24:123-140.
- Friedman JH. Greedy function approximation: a gradient boosting machine. Annals of statistics. 2001:1189-1232.
- Hopfield JJ. Neural networks and physical systems with emergent collective computational abilities. Proc Natl Acad Sci USA. 1982;79:2554-2558.
- He B, Zhao W, Pi J-Y, et al. A biomarker basing on radiomics for the prediction of overall survival in non–small cell lung cancer patients. Respiratory research. 2018;19:1-8.
- Shinde S, Prasad S, Saboo Y, et al. Predictive markers for Parkinson's disease using deep neural nets on neuromelanin sensitive MRI. NeuroImage: Clinical. 2019;22:101748. [Crossref][Google scholar][Pubmed]
- Bernatz S, Ackermann J, Mandel P, et al. Comparison of machine learning algorithms to predict clinically significant prostate cancer of the peripheral zone with multiparametric MRI using clinical assessment categories and radiomic features. European radiology. 2020;30:6757-6769.
- Cao H, Bernard S, Sabourin R, et al. Random forest dissimilarity based multi-view learning for Radiomics application. Pattern Recognition. 2019;88:185-197.
- Deist TM, Dankers FJWM, Valdes G, et al. Machine learning algorithms for outcome prediction in (chemo)radiotherapy: An empirical comparison of classifiers. Medical physics. 2018;45:3449-3459.
- Torlay L, Perrone-Bertolotti M, Thomas E, et al. Machine learning-XGBoost analysis of language networks to classify patients with epilepsy. Brain Inform. 2017;4:159-169.
- Colen RR, Rolfo C, Ak M, et al. Radiomics analysis for predicting pembrolizumab response in patients with advanced rare cancers. J Immunother Cancer. 2021;9.
- Yun J, Park JE, Lee H, et al. Radiomic features and multilayer perceptron network classifier: a robust MRI classification strategy for distinguishing glioblastoma from primary central nervous system lymphoma. Scientific reports. 2019;9:1-10.
- Bae S, An C, Ahn SS, et al. Robust performance of deep learning for distinguishing glioblastoma from single brain metastasis using radiomic features: model development and validation. Scientific reports. 2020;10:1-10.
- Jollans L, Boyle R, Artiges E, et al. Quantifying performance of machine learning methods for neuroimaging data. NeuroImage. 2019;199:351-365.


