Research Article - Onkologia i Radioterapia ( 2023) Volume 17, Issue 9
A dose volume histogram based correction factor for dosimetric comparison of radiotherapy treatment plans: preliminary study
M. Boopathi1,2, D. Khanna1*, P. Mohandass3, P. Venkatraman4, K. Kanakavel5, C. Narmada5 and S.Vignesh52Dharan Cancer Speciality Centre Pvt Ltd, Salem, India
3Department of Radiation Oncology, Fortis Cancer Institute, Fortis Hospital, Mohali, Punjab, India
4Departments of Medical Physics, Bharathidasan University, Trichy, India
5PTW Dosimetry India Pvt Ltd, Chennai, India
D. Khanna, Department of Applied Physics, Karunya Institute of Technology and Sciences, Coimbatore, India, Tel: +91 9080776415, Email: davidkhanna@karunya.edu
Received: 29-Aug-2023, Manuscript No. OAR-22-111672; Accepted: 25-Sep-2023, Pre QC No. OAR-22-111672 (PQ); Editor assigned: 31-Aug-2023, Pre QC No. OAR-22-111672 (PQ); Reviewed: 09-Sep-2023, QC No. OAR-22-111672 (Q); Revised: 19-Sep-2023, Manuscript No. OAR-22-111672 (R); Published: 30-Sep-2023
Abstract
Purpose: Objective of this present study is to assess the correlation factor kDVH (Dose Volume Histogram) for the Verisoft PTW software for different clinical sites. Materials and methods: Utilizing a simple dose reconstruction method in OCTAVIUS® 4D phantom, the measured dose in the array is 3D reconstructed. The DVH derived from Treatment Planning System (TPS) is compared with the DVH generated in Verisoft software from the measurement. To match these obtained histograms, user defined correction factor available in Verisoft application. The present study is intended to obtain a constant value that could be helpful in the comparison between the TPS DVH with the Verisoft generated DVH for all the clinical manifestations. In the present study, 9 cases, 10 cases, 11 cases and 10 cases of Oesophagus, Brain, Rectum and Head & Neck respectively total 40 cases have been taken for the calculation of this correction. With 1.000 kDVH default value, maximum dose for all the structures were examined in VeriSoft PTW software. The average values in the TPS for DVH and maximum values for VeriSoft were obtained for all the given structures in the different cases. Results: The results of DVH derived from TPS compared with Varisoft generated DVH for all four clinical sites. The comparison results of mean and maximum dose of target and OAR volumes did not show any significant dose difference (p>0.05). In addition, mean deviation factor obtained was <1% which ensure that the derived constant value does not does not disturb the software calculation but enhances the quality of the DVH as like TPS DVH. Therefore, user can trust the use of kDVH in the Verisoft Software to improve the DVH Calculation. The value of kDVH was evaluated for both Neck & Head and Rectum cases such as 1.000 and 1.022. From the results obtained, it was found that 1.022 kDVH (constant value) would be better that can match the correction factor for Measured Verisoft DVH and TPS DVH. Conclusion: The average kDVH value 1.022 is derived and this value will act as the baseline for comparing and calculating TPS with Verisoft PTW software.
Keywords
dose volume histogram, PTW software–verisoft, OCTAVIUS® 4D phantomIntroduction
In Linear Accelerator (LINAC) based treatment in radiotherapy, Intensity modulated radiotherapy is a milestone in technological improvement. The technique used in Intensity modulated radiotherapy (IMRT) is the same as three dimensional radiotherapy (3DCRT) and uses beams generated from multiple photons that are focused from many gantry angles for producing conformal distribution of dose near the target volumes. But, the major difference between IMRT and 3DCRT is the procedure of generation of dose distribution. IMRT utilizes beams within the aperture wherein fluence distribution is heterogeneous whereas 3DCRT utilizes beams with a wedged or uniform fluence distribution within defined MLC aperture [1-6]. The conformity level achieved through IMRT is higher as compared to 3DCRT allowing greater OARs sparing without compromising delivery of dose to the target volumes. Beam intensity modulation could be achieved in two ways: during the delivery of a beam like ‘sliding window’ or dynamic MLC approach, dynamic MLC motion is utilized and another method, shoot and step approach wherein each beam comprises multiple subfields known as segments.
In the step and shoot approach, every subfield or segment consists of specified and defined MLC weighting and aperture. Defined MLC aperture decides the irradiated regions whereas aperture weighting determines the radiation quantity to be delivered via aperture. The delivered integral dose via beam consists of multi-segments estimated as the total of contributions in dose from every segment. Intensity modulation at the desired rate for a beam is thus created by selecting the appropriate segment combinations. In the approach, “sliding window”, MLC has two banks that travel across the field and defines a narrow window at the time of continuous irradiation. The width and shape of the window varies and cannot be determined exactly because it travels through the field with burying dose rate in LINAC. Regardless of the delivery approach utilized, the overall five IMRT plan comprises modulated beams at multiple intensity directed from numerous gantry angles and typically, the beam numbers are either five or seven [7-13].
For the implementation of such a treatment modality, there are a requirement of three systems. A treatment planning system which calculates fluence maps non-uniformly from multiple directions of the beam head, a radiation delivering system which delivers beam fluence of various kinds. Treatment Planning System (TPS) is used to calculate IMRT plans that are based on the “inverse planning” principle. The concept of this inverse planning is that fundamentally TPS determines the required beams that fluence or satisfy the objectives in a user-defined manner for the achievement of desired dose distribution. The inverse planning defines the beam number and its directions along with constraints in dose-volume and dose prescriptions in required amount TPS divides every beam into beamlets in large numbers and determines the fluence optimum setting iteratively and evaluation of every successive dose distribution. In every IMRT field, the intensity modulation of a complex beam requires a new system for the delivery of treatment, inverse TPS and patient set-up [13-19]. In plan verification for QA in IMRT is complex as 3D-conformal therapy. Small segments of varying segments form the individual beams that are located on the central axis of the beam in an on and off manner. For verifying IMRT plans, main approaches are Monitor Unit Calculation and dosimetric measurement like PDD (Present Depth Dose) and dose profiles for small fields.
In intensity modulation, different types of test cases are performed to check the delivery as well as planning of the IMRT treatments with overall accuracy. Contours are used in each test cases which has avoidance structure and targets within rectangular phantoms. By utilizing numerous IMRT planning systems, the tests cases are measured, planned, delivered and analysed [2]. Ion chamber is used to determine the agreement between measured and planned doses in low and high dose regions and also film dosimetry performed with the phantom used to measure all fields on the coronal plans. Whereas to measure planar dosimetry for every field, it is measured perpendicular to the central axis.
For the IMRT quality assurance, the point dose is not sufficient to ensure the delivery of treatment. Considering this, special kinds of phantoms are needed that allows determination of dose distribution for resultant or one field dose distribution from total fields. In TPS, the treatment plan can be transferred on QC phantom altogether with dose constraints and field recalculation and configuration of the phantom is done. Followed by the phantom irradiation, quantitative value evaluation is calculated and measured.
Accuracy in the calculation of MU could be measured at a particular point using an ionisation chamber in the water equivalent phantom homogeneous in nature. But, in this method, distant segments from the selected point cannot be measured and checked. Therefore, it is recommended to use 2D array is for checking all the segments. The purpose of this study is to evaluate correlation factor kDVH using Verisoft PTW software by comparing DVH derived from Treatment Planning System (TPS) with DVH generated in Verisoft software from the measurement for different clinical sites.
Materials and Methods
Array detectors
For yielding cumulative and multiple readings, array detectors are calibrated of the absorbed dose on the 2D plan that represents popular and recent addition to the available tools for clinical routine IMRT QA that increases efficiency. Large number of dose measurements can be obtained through cross-calibration in per beam or single irradiation with the available results. A key feature of IMRT QA is immediate results which facilitates diagnosis of magnitude estimation as well as common error sources efficiently. The errors can occur in the process of estimation of penumbral, leaf calibration and modelling of output factor (small-field) in the planning-treatment system. Errors in leaf-positioning can be diagnosed using measurement discrepancies lying along the leaf pair trajectory. Present array detectors possess low spatial resolution (7 mm) limiting its role in the routine QA in an IMRT technique (pre-commissioned) [20].
Octavius® system and PTW array
PTW detector array 729:
Total plan verification of LINAC QA and IMRT are conducted using a single detector which is the lightest ionization chamber array (2D-flat panel) as described in figure 1. This detector has high field coverage and superior directional response as compared to other detectors as it has geometrically uniform and unique matrix design and cubic detector as described in table 1.

Figure 1: Configuration of Octavius® detector array
Tab. 1. PTW detector array 729
| Detector Type | Ion chamber (Plane-parallel) |
|---|---|
| Number of detector | 729 detectors (0.0125cc) |
| Detector Size | 5x5x5mm |
| Detector Spacing | 5mm edge-to-edge, 10mm centre-to- centre |
| Maximum Field Size | (27x27)cm2 |
The OCTAVIUS® 4D phantom rotates with the gantry synchronously in dose measurements (single-resolved) as shown in figure 2. During the period of measurements, the complete volume of the phantom is covered with measuring points and as per the detector panels, application with various spatial resolutions which could be utilized in the rotational phantom. For avoiding angular correction, the incident beam is perpendicular to the detector panel surface always, the data is gathered and evaluated by software package-Verisoft as a section of OCTAVIUS® 4D as shown in figure 3.

Figure 2: Configuration of PTW Octavius® 4D system

Figure 3: Octavius® 4D system measured dose for different angles in gantry
There is accumulation of data at measuring intervals or periods of 200 milliseconds and this is considered as the best measuring interval as it compromises the best between the optimal correlation and most accurate data for Gantry and dose angle values. This interval of 200 mS and its integration into a high ratio of signal-to-noise and the dose value does not need any further smoothing. Instead of silicon diodes, the ionisation chambers use is advantageous because chambers have finer design of signal-tonoise ratio. In addition, the measuring interval of 200 mS secure good correlation between Gantry angles and dose data. Due to this measuring interval of 200 mS, the uncertainty in Gantry angle arises to ±0.6° assuming the Gantry speed at the highest having 360° per minute. Combining this uncertainty Gantry angle with inherent inclinometer angle of uncertainty ± 1°, it results in total uncertainty for the 3D dose of the Gantry angle reconstruction algorithms ± 1.2° with 360° per minute gantry speed.
3D dose reconstruction procedures in the Octavius®
Using 4D phantom-commissioning of Octavius® 4D system:
On the basis of dose measurements, OCTAVIUS® 4D algorithm is determined at a certain depth on the depth dose curves (PDDs) percentage and phantom which are used for reconstructing values of dose along the line of ray that are connected to the relevant detectors focusing on the beam. OCTAVIUS® 4D technique is simple, but it is limited to PDD. Phantom’s density adjustment in the TPS is not complicated and for commissioning PDD, it is estimated in water phantom at 85 cm distance on source-surface ratio. It is measured at 4 cm² × 4 cm², 10 cm² × 10 cm² and 26 cm² x 26 cm² field sizes which are mandatory and extra field sizes that may enhance the accuracy slightly of the reconstruction algorithms. OCTAVIUS® 4D phantom electron density in the TPS relative to the water must be set at 1.016 and if TPS does not support it, the corresponding Hounsfield Unit or phantom mass density utilized by TPS need to be adjusted as per the suggested procedure of the manufacturer. Utilizing artificial CT files, the phantom imports onto TPS supported by OCTAVIUS® 4D system or performed by a CT scan in the absence of a detector panel.
Octavius® 4D phantom-dose distribution
The Verisoft software used in OCTAVIUS® 4D is designed for calculating gamma and constructing 3D dose grids without the use of information of dosage from the planning treatment system. Thus, the QA test tool and its measuring results are independent of the treatment plan completely. The reconstruction algorithms used in software is easy to decode and understand.
n the OCTAVIUS® 4D phantom, PDD is converted which is measured in water to PDD upon commissioning utilizing the relation of phantom materials and electron densities in water. During the current gantry time (angle), consider a single detector in the panel or current detector and the dose Ddet in Gy is measured at this position. A line of ray is constructed by current detector to the beam focus and current field size is determined from the irradiation detectors. In context to non-central-axis TPRs, apply corrections as follows; beams having flattening filters, or as Flattening Filter Free (FFF) beams [4, 5]. Within the phantom, for the present field size, the PDD, dose value reconstruct D(r) in Gy from the current detector at the r distance along the line of ray as per the equation (1) and is done for all the detectors in the panel and also for all the Gantry angles. Then the dose values are sorted into voxels by the user that could be changed to the size 2.5 mm³ x mm³ 2.5 mm³ x 2.5 mm³ through linear interpolation. A 3 cm layer is removed in thickness for the detector 729 from the phantom’s outer shell for obtaining dose grid from cylinder with length and diameter of 26 cm each. For the 1000 SRS Detector, the diameter and length is 26 cm of the reconstructed cylinder.
The dose D(r) is derived from the DDet (0) dose along the ray of line which is measured through the current detector utilizing the relationship given below.
PDD(r)
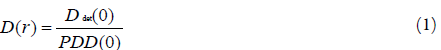
Where,
PDD(0) and PDD(r) are the depth dose percentage values at a distance r from the current detector positioned and current detector respectively
From the reconstructed data, the phantom’s outer shell is removed as no detectors exist in that region. The detector that surrounded the central detector accounts for the scattered radiation. ~1.1 million dose points or voxels are reconstructed for a typical VMAT plan. The time for dose reconstruction is ~25 seconds in OCTAVIUS® 4D.
Dose distribution in the patient
In context to the patient, for reconstructing 3D dose distribution, CT data along with the structure densities are imported into VeriSoft. The following steps help in patient dose reconstructing described below. However, there is a separate procedure in the step g and on a contrary to the phantom, along the line of ray, the patient is not homogenous, but shows structures with varying densities. Moreover, the source-to-surface-distance is also different due to irregular shape of the contour of the patient. OCTAVIUS® 4D phantom is focused along the line of ray (3) and the current detector (2) and not to scale. The patient’s surface is the contour from the CT and the current detector determines the dose DDet at the depth of water-equivalent ZPhantom. For the current voxel, the reconstructs algorithm for dose DCT in the CT image (1) at the depth of water-equivalent zCT. aCT and aDet are geometrical intervals from the focus to the current voxel and to the current detector respectively presented in Figure 4.

Figure 4: Dose distribution in the patient
DCT is established when the patient dose given at a certain point along the ray line is determined. DCT evolves from the interaction between the measured dose in the phantom by the dose at a certain point on the line of ray and the current detector DDet in the CT image. The steps involved in the algorithm are as follows:
• PDD is converted into tissue-phantom-ratio (TPR)
• “Current voxel” or a point is selected on the constructed line of ray in d
• Hounsfield units are converted into electron densities from the CT image along the line of ray (6).
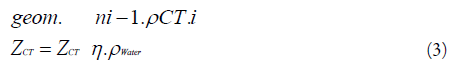
• Water-equivalent current detector depth is determined in the zDeT phantom by multiplying geometric depth with ratio of phantom material electron densities and water.
• The current voxel water-equivalent depth is determined in the patient and zCT is determined as the equation given in (3)
• Geometric distances between a Det (between current detector and focus) and aCT (current voxel and focus) are determined.
• DCT or does in the patient is calculated at the current voxel by applying equation (2).
• The previous step is followed for all the voxels inside the contour of the patient along the line of ray.
The dose reconstruction in the CT image or in the patients along the line of ray through the focus and the current detector is based on the (2) equation. Mentioned below are the abbreviations for the acronym.
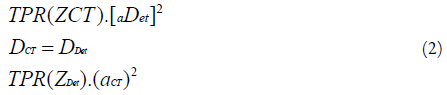
In the equation (2) the first factor denotes the various thicknesses of the material overlying ahead of the current voxel in the CT or in the patient and current detector in the phantom. In the patient, zCT or water-equivalent depth of current voxel is derived from the materials electron densities and geometrical depth CTz involved.
Where
N = figure of voxels along the ray line from the current voxel to the patient surface,
ρWater = water electron density
ρCT = voxel electron density (i = 1, 2, n).
In equation (2), the second term denotes the various distances to the line of focus by using inverse square law. TPR are transformed from the estimated PDD through inverse square law as per BJR 11 (7) in the equation (2). However, this algorithm is not capable of changing the scattered radiation because the location on line of the ray possesses different density while passing through the structures. The time required for reconstructing 3D dose distribution by OCTAVIUS® 4D in the patient is two minutes.
In the patient plan, dose distributions are mostly observed by Dose-Volume Histogram (DVH) which is employed for various structures like target volumes or OAR (Organ At Risk) instead of the irradiated volume. For determining DVH, VeriSoft software imports the patient structures geometry from the TPS, uses an algorithm of 3D dose distribution (reconstructed) in the patient and obtains the histograms from dose values within the structures. The software considers the structures in the OCTAVIUS® 4D phantom that measures volume. DVH curves are exported as allowed by the TPS, it could be differentiated with the DVH curves as obtained by the OCTAVIUS® 4D phantom given above in figure 5.

Figure 5: Dose volume histograms in the geometry of the patient estimated by TPS (solid lines) and OCTAVIUS® 4D (dashed line)
Verisoft software
This software helps the physicists to compare the dose distributions obtained in the treatment planning system. Calculated and measured points matrices of an IMRT beam can be compared by subtraction of the matrices and visualization of the results [3]. Gamma evaluation procedure is supported by this software as it aids in locating cold and hot sports and also determines the average and maximum deviation between measured and calculated plan as presented in Figure 6.

Figure 6:PTW VeriSoft Software
Dose volume histogram
DVH has the ability to encapsulate the whole dose distribution in one curve for every required anatomic structure along with quantitative information on the absorbed dose by volume. Two kinds of DVH are available; (i) Differential DVH (ii) Cumulative DVH. The plot in the differential DVH represents volume within a dose under a particular dose bin or dose interval as a function of dose and shows the extent or degree of dose variation within a specified structure. For instance, for an evenly irradiated structure, the differential DVH calculated is a single bar which is 100% by volume at the stated dose. The plot in the cumulative DVH is the volume of a specified structure that receives a certain dose which is at a higher rate as a function of dose and on the curve, any point represents volume received at the specified dose or higher than that. Out of the two kinds of DVH, cumulative type is more advantageous and used commonly as compared to the differential DVH form.
Results and Discussion
Dose distribution comparison and evaluation
The Patient Specific QA is the most important part of reassuring the dose calculations, so the quality of it should be a major concern. Earlier it was done by using radiographic films which brought more uncertainties and limitations that errors made during the calculation was irreversible. Then the patient specific QA was done using EPID with Gamma index Analysis method. Gamma index Analysis is a tool to compare dose differences in TPS calculated and measured dose distributions, following the criteria DD (Dose Difference) and DTA (Distance to Agreement), usually 3% Dose difference with 3 mm Distance to Agreement is followed clinically. Then came the 2D array detector, a 2D dose calculation-based detector, which uses a plane of detector (e.g., 729, 1000, 1500) to calculate the dose distribution. But it showed some uncertainties in regarding Spatial resolution and sensitivity. In our study, OCTAVIUS® 4D phantom is used which uses a plane of 729 detector array placed perpendicular to the beam direction.
The Phantom is designed to rotate along with the gantry rotation aided by a sensor, thus achieving a volumetric dose distribution. Even though EPID was found to be most efficient of the different devices, OCTAVIUS® 4D phantom being more accurate with its 3D volumetric dose calculations compared to other QA devices. OCTAVIUS® 4D phantom calculates and stores the information like PDD and TMR for certain field sizes and depths. With all these information, OCTAVIUS® 4D phantom calculates the dose distributions itself with Verisoft software, when it is fed with the planning information of a patient (Gantry angle, field sizes depth etc). It creates its own DVH without depending the TPS beam data information. In our study, we compare this DVH with the sophisticated TPS DVH and we aimed to reduce the dose distribution differences by including a constant value kDVH derived from analysing certain group of patients with different tumour sites.
In this study, various cases were analysed to derive the constant value kDVH which serves as a baseline correction factor for comparing the DVHs of TPS and Verisoft software. The derived kDVH gives an approximate equal DVHs in Verisoft Software compared with TPS DVH. Some Rectum and Head & Neck cases and their results are discussed below.
Figure 7 A, B, and C and Table 2 is the Dose distribution evolution comparison between VERISOFT and TPS at kDVH 1.022 and 1.000 various cases. Different Rectum cases were analysed and their factors are like 0.966, 0.976, 1.040, 1.043, 1.021, 1.017, 1.041, 0.999, 1.008, 1.019, 1.037, 0.986, and 1.014.

Figure 7: A, B, and C the evolution of Dose distribution comparison between TPS and VERISOFT at kDVH 1.000 and 1.022
Tab. 2. The Dose distribution evolution comparison between VERISOFT and TPS at kDVH 1.022 and 1.000 respectively for rectum cases
| Target and OAR Volumes | Rectum case 1 | Rectum case 2 | Rectum case 3 | |||
|---|---|---|---|---|---|---|
| TPS | VERISOFT | TPS | VERISOFT | TPS | VERISOFT | |
| GTV | 53.7 | 54.6 | 53.7 | 53.4 | - | - |
| Vessel | 53.9 | 54.6 | 53.9 | 53.4 | 54.7 | 52.9 |
| Bladder | 53.6 | 54.6 | 53.6 | 53.4 | 55.3 | 53.2 |
| Rectum | 53.7 | 54.6 | 53.7 | 53.4 | - | - |
| CTV Vessel | 54.5 | 54.7 | 54.5 | 53.6 | 55.3 | 53.3 |
| CTV Rectum | 54 | 56.3 | 54 | 55.1 | - | - |
| CTV Total | 54.5 | 56.3 | 54.5 | 55.1 | 55.3 | 53.2 |
| PTV 50.4 IN 28 | 54.5 | 57.2 | 54.5 | 55.9 | 55.3 | 53.3 |
| AVERAGE | 54.05 | 55.3 | 54.05 | 55.9 | 55.2 | 52.9 |
| DEVIATION | 0.97 | 0.96 | 1.04 | |||
Figure 8 a, b, c and Table 3 shows the Dose distribution evolution comparison between VERISOFT and TPS at kDVH 1.022 and 1.000 various cases. Different head and neck cases were analysed and their factors like 1.027, 1.006, 1.133, 1.008, 1.008, 1.014, 0.998, 0.995 and 0.976.

Figure 8: a, b, and c shows dose distribution evolution comparison between VERISOFT and TPS with kDVH 1.022 and 1.000 respectively
Tab. 3. The evolution of dose distribution comparison between TPS and VERISOFT at kDVH 1.000 and 1.022 respectively for head and neck cases
| Target and OAR Volumes | Head and neck case 1 | Head and neCK case 2 | Head and neck case 3 | |||
|---|---|---|---|---|---|---|
| TPS | VERISOFT | TPS | VERISOFT | TPS | VERISOFT | |
| Mandible | 66.1 | 66 | 66.1 | 67.4 | 75 | 67.4 |
| CTV TV Bed | 68.7 | 66.1 | 68.7 | 67.5 | 74 | 55.7 |
| CTV60 | 66.1 | 64.2 | 66.1 | 65.6 | 60.2 | 60.2 |
| Parotid Lt | 66.3 | 64 | 66.3 | 65.4 | 75.5 | 64.4 |
| Parotid Rt<20 Gy | 61.3 | 56.2 | 61.3 | 57.5 | 73.9 | 52.9 |
| Larynx | 64.6 | 64.4 | 64.6 | 65.8 | 71.1 | 68.3 |
| Oral cavity ALARA | 66.9 | 65 | 66.9 | 66.5 | 73.2 | 70.3 |
| CTV54 | 63.8 | 63.6 | 63.8 | 65 | 72.9 | 59 |
| PTV60 in 30Fr | 68.7 | 66.1 | 68.7 | 67.5 | 75.5 | 65.5 |
| PTV54 in 30 Fr | 61.3 | 62.5 | 61.3 | 63.9 | 73.7 | 68.4 |
| Lip ALARA | 64.8 | 61 | 64.8 | 62.4 | 70.1 | 69.1 |
| AVG | 65.3 | 63.5 | 68.7 | 67.5 | 72.2 | 63.7 |
| DEV | 1.02 | 1 | 1.13 | |||
The Varian TrueBeam® STx linear accelerator was used to commission the Octavius® 4D. PDD measurements were made for field sizes ranging from 4 cm2 x 4 cm2 to 26 cm2 x 26 cm2 measured at an SSD of 85 cm. The artificial Octavius® 4D CT supplied by the vendor was used for plan verification. Different field sizes were used (5 x 5, 10 x 10, 15 x 15 and 20 cm2 x 20 cm2 ) to verify the commissioning of Octavius® 4D by γ- analysis with acceptance criteria of 3 mm/3%. Also, by inserting a PTW Semiflex 3D ionisation chamber (volume 0.07 cc, type 31021) into a RW3 slab in place of the 2D array inside Octavius® 4D, the central chamber of the array was cross-calibrated in order to achieve absolute dose. Field 10 x 10 cm2 , gantry at 0°, 200 MU, which corresponds to 1.228 Gy, was used as the reference condition for measurements. The dose value was calculated from the chamber signal using the IAEA Technical Report Series 398 approach, accounting for the daily LINAC output factor correction. In order to validate Octavius® 4D for absolute dose assessment, a comparison with the central chamber measurement under the same circumstances allowed for the deduction of the so-called K-user factor for the LINAC. To assess how well the two approaches were consistent, this result was compared to the K-cross.
The treatment QA delivery was performed by Varian TrueBeam STx equipped with HD 120 MLC and 6MV energy used for all the plans. Dose distribution were computed for all treatment plans of 54 various clinical cases. Treatment regions were Brain (n=10, 18.5%), Head and Neck (n=11, 20.4%), Oesophagus (n=12, 22.2%), Rectum (n=11, 20.4%) and Cervix (n=10, 18.5%). A summary of treatment plan characteristic is tabulated (Table 4).
Tab. 4. Mean deviation and p-value derived for various cases with certain number of patients
| Tumor Site | No of patients | MU | Segments | Maximum Dose | Mean Dose | ||||||
|---|---|---|---|---|---|---|---|---|---|---|---|
| with CF | without CF | MD (%) | p-value | with CF | without CF | MD (%) | p Value | ||||
| Brain | 10 | 820 | 145 | 1.71 | 1.9 | 0.19 | 0.616 | 1.7 | 1.9 | 0.2 | 0.222 |
| Head and Neck | 11 | 998 | 197 | 2 | 2.89 | 0.89 | 0.233 | 2 | 2.89 | 0.9 | 0.016 |
| Esophagus | 12 | 787 | 157 | 1.68 | 2.52 | 0.84 | 0.105 | 0.7 | 0.75 | 0.1 | 0.172 |
| Rectum | 11 | 688 | 174 | 1.39 | 1.35 | 0.05 | 0.83 | 1.7 | 1.9 | 0.2 | 0.812 |
| Cervix | 10 | 877 | 147 | 1.1 | 1.8 | 0.7 | 0.815 | 1.7 | 2.12 | 0.5 | 0.815 |
This study is carried out by using 54 various cases mentioned in above table. The Mean dose and maximum dose for the given patients and their Mean deviation were calculated. The table gives the mean deviation values of mean and maximum dose derived with and without Correction Factor (CF) included in the DVH created by Verisoft. The mean deviation factor obtained is less than 1%, which proves that the derived constant value does not disturb the software calculation but enhances the quality of the DVH as like TPS DVH. Hence, we can trust the use of kDVH in the Verisoft Software to improve the DVH Calculation. Also, the p value obtained is above 0.05 which is considered as insignificant and can be improvised. This study aims on that to make a significant difference in the quality of Patient Specific QA.
Comparison of measured and TPS DVH
Eventually, the value of kDVH is evaluated for both neck and head and rectum cases. The graph below shows the DVH for kDVH 1.000 and kDVH 1.022. From the results obtained, it can be concluded that 1.022 kDVH (constant value) would be better that can match the correction factor for Measured Verisoft DVH and TPS DVH shown in figure 9 &10. The DVH of Verisoft with kDVH 1.022 approximates the TPS DVH which achieves the ultimate purpose of this study

Figure 9: The value of kDVH of head and neck case (kDVH 1.000)

Figure 10: The value of kDVH of rectum cases (kDVH 1.022)
Discussion
The Varian TrueBeam® STx linear accelerator was used to commission the Octavius® 4D. PDD measurements were made for field sizes ranging from 4 cm2 x 4 cm2 to 26 cm2 x 26 cm2 measured at an SSD of 85 cm. The artificial Octavius® 4D CT supplied by the vendor was used for plan verification. Different field sizes were used (5 x 5, 10 x 10, 15 x 15 and 20 cm2 x 20 cm2 ) to verify the commissioning of Octavius® 4D by γ- analysis with acceptance criteria of 3 mm/3%. Also, by inserting a PTW Semiflex 3D ionisation chamber (volume 0.07 cc, type 31021) into a RW3 slab in place of the 2D array inside Octavius® 4D, the central chamber of the array was cross-calibrated in order to achieve absolute dose. Field 10 x 10 cm2 , gantry at 0°, 200 MU, which corresponds to 1.228 Gy, was used as the reference condition for measurements. The dose value was calculated from the chamber signal using the IAEA Technical Report Series 398 approach, accounting for the daily LINAC output factor correction. In order to validate Octavius® 4D for absolute dose assessment, a comparison with the central chamber measurement under the same circumstances allowed for the deduction of the so-called K-user factor for the LINAC. To assess how well the two approaches were consistent, this result was compared to the K-cross.
The treatment QA delivery was performed by Varian TrueBeam STx equipped with HD 120 MLC and 6MV energy used for all the plans. Dose distribution were computed for all treatment plans of 54 various clinical cases. Treatment regions were Brain (n=10, 18.5%), Head and Neck (n=11, 20.4%), Oesophagus (n=12, 22.2%), Rectum (n=11, 20.4%) and Cervix (n=10, 18.5%). A summary of treatment plan characteristic is tabulated (Table 4).
This study is carried out by using 54 various cases mentioned in above table. The Mean dose and maximum dose for the given patients and their Mean deviation were calculated. The table gives the mean deviation values of mean and maximum dose derived with and without Correction Factor (CF) included in the DVH created by Verisoft. The mean deviation factor obtained is less than 1%, which proves that the derived constant value does not disturb the software calculation but enhances the quality of the DVH as like TPS DVH. Hence, we can trust the use of kDVH in the Verisoft Software to improve the DVH Calculation. Also, the p value obtained is above 0.05 which is considered as insignificant and can be improvised. This study aims on that to make a significant difference in the quality of Patient Specific QA.
Comparison of measured and TPS DVH
Eventually, the value of kDVH is evaluated for both neck and head and rectum cases. The graph below shows the DVH for kDVH 1.000 and kDVH 1.022. From the results obtained, it can be concluded that 1.022 kDVH (constant value) would be better that can match the correction factor for Measured Verisoft DVH and TPS DVH shown in figure 9 &10. The DVH of Verisoft with kDVH 1.022 approximates the TPS DVH which achieves the ultimate purpose of this study
Conclusion
DVH derived from VeriSoft does not match accurately with the algorithm generated from the sophisticated TPS. From the present study, we came up with a correction factor being common for all types of anatomical sites in a specific clinic by deriving correction factor from evaluation of kDVH for the total of 40 cases from a health clinic. The average values of the VeriSoft and TPS maximum values were derived for all the structures for various cases. The calculation of the mean of these values has been obtained as 1.022. The difference of TPS DVH with the generated DVH value through VeriSoft by utilizing kDVH has been obtained as 1.022 which gives an acceptable value that matched for all the cases of Oesophagus, Brain, Rectum and Head and Neck respectively. From our study, we conclude that the difference between the DVH calculated in TPS and VeriSoft application is found to be significant. And further studies to be carried out with more number of patient plans with different sites to present the difference more appealing.
References
- Das IJ, Cheng CW, Chopra KL, Mitra RK, Srivastava SP, et al. Glatstein E. Intensity-modulated radiation therapy dose prescription, recording, and delivery: patterns of variability among institutions and treatment planning systems. Journal of the National Cancer Institute. 2008 Mar 5;100:300-7.
- Spezi E, Angelini AL, Romani F, Ferri A. Characterization of a 2D ion chamber array for the verification of radiotherapy treatments. Physics in Medicine & Biology. 2005 Jul 6;50:3361. [Google Scholar] [Cross Ref]
- Tailor RC, Tello VM, Schroy CB, Vossler M, Hanson WF. A generic offâ?axis energy correction for linac photon beam dosimetry. Medical physics. 1998 May;25:662-7. [Google Scholar] [Cross Ref]
- Georg D, Kragl G, Af Wetterstedt S, McCavana P, McClean B, et al. Photon beam quality variations of a flattening filter free linear accelerator. Medical physics. 2010 Jan;37(1):49-53. [Google Scholar] [Cross Ref]
- Thomas SJ. Relative electron density calibration of CT scanners for radiotherapy treatment planning. The British journal of radiology. 1999 Aug;72:781-6. [Google Scholar] [Cross Ref]
- Boles M. Central axis depth dose data for use in radiotherapy. [Cross Ref]
- Piermattei A, Arcovito G, Azario L, Bacci C, Bianciardi L, et al. A study of quality of bremsstrahlung spectra reconstructed from transmission measurements. Medical physics. 1990 Mar;17:227-33. [Google Scholar] [Cross Ref]
- Knöös T, Johnsson SA, Ceberg CP, Tomaszewicz A, Nilsson P. Independent checking of the delivered dose for high-energy X-rays using a hand-held PC. Radiotherapy and Oncology. 2001 Feb 1;58:201-8. [Google Scholar] [Cross Ref]
- Georg D, Dutreix A. Methods for beam data acquisition offered by a mini-phantom. Physics in Medicine & Biology. 1999 Apr 1;44:817. [Google Scholar] [Cross Ref]
- Johnsson SA, Ceberg CP. Offâ?axis primaryâ?dose measurements using a miniâ?phantom. Medical Physics. 1997 May;24:763-7. [Google Scholar] [Cross Ref]
- Zefkili S, Kappas C, Rosenwald JC. Onâ?axis and offâ?axis primary dose component in high energy photon beams. Medical physics. 1994 Jun;21:799-808. [Google Scholar] [Cross Ref]
- Nystrom H, Karlsson M. Photon beam quality specification by narrow-beam transmission measurements. Physics in Medicine & Biology. 1994 Aug 1;39:1231. [Google Scholar] [Cross Ref]
- Lee PC. Monte Carlo simulations of the differential beam hardening effect of a flattening filter on a therapeutic xâ?ray beam. Medical physics. 1997 Sep;24:1485-9. [Google Scholar] [Cross Ref]
- Cashmore J. The characterization of unflattened photon beams from a 6 MV linear accelerator. Physics in Medicine & Biology. 2008 Mar 11;53:1933. [Google Scholar] [Cross Ref]
- Titt U, Vassiliev ON, Pönisch F, Dong L, Liu H, et al. A flattening filter free photon treatment concept evaluation with Monte Carlo. Medical physics. 2006 Jun;33:1595-602. [Google Scholar] [Cross Ref]
- Vassiliev ON, Titt U, Pönisch F, Kry SF, Mohan R, et al. Dosimetric properties of photon beams from a flattening filter free clinical accelerator. Physics in Medicine & Biology. 2006 Mar 22;51:1907. [Google Scholar] [Cross Ref]
- Karlsson M, Nyström H, Svensson H. Photon beam characteristics on the MM50 racetrack microtron and a new approach for beam quality determination. Medical physics. 1993 Jan;20:143-9. [Google Scholar] [Cross Ref]
- Jeraj R, Mackie TR, Balog J, Olivera G, Pearson D, et al. Radiation characteristics of helical tomotherapy. Medical physics. 2004 Feb;31:396-404. [Google Scholar] [Cross Ref]
- Balog JP, Mackie TR, Reckwerdt P, Glass M, Angelos L. Characterization of the output for helical delivery of intensity modulated slit beams. Medical Physics. 1999 Jan;26:55-64. [Google Scholar] [Cross Ref]
- Hanson WF, Berkley LW, Peterson M. Offâ?axis beam quality change in linear accelerator xâ?ray beams. Medical physics. 1980 Mar;7:145-6. [Google Scholar] [Cross Ref]


