Research Article - Onkologia i Radioterapia ( 2021) Volume 15, Issue 8
Validation and comparison of intensity modulated radiation therapy patient plans with Octavius 4D Phantom using the Gamma Index analysis in 2D and 3D
Sanae Douama, Moulay Ali Youssoufi, Mohammed Bougtib, Youssef Bouzekraoui*, Mohamed Ait Erraisee, Fatima Zahra Abboud, Souad Oubelkacem, Khalid Hassouni, Khalid Hassouni, Drissi Lalla btissam and Farida Bentayeb2Faculty of Sciences (LPHE, M-S), University Mohammed V, Rabat, 10010, Morocco
3Department of Radiotherapy, University Hospital Hassan II, Fes, 30003, Morocco
4Department of Radiotherapy, University Hospital Hassan II, Fes, 30003, Morocco
Youssef Bouzekraoui, Faculty of Sciences (LPHE, M-S), University Mohammed V, Rabat, 10010, Morocco, Email: youssef0fsr@gmail.com
Received: 26-May-2021 Accepted: 02-Aug-2021 Published: 09-Aug-2021
Abstract
Purpose: The aim of this work is to investigate the dose verification of common conventional Intensity Modulated Radiation Therapy (IMRT) Quality Assurance (QA) performance metric using verisoft software. Based on Gamma index analysis we performed a comparison between 2D and 3D of the delivered and planed dose for complex geometry, Gamma index passing rate (GP%) is calculated using different criteria 3%/3 mm, 3%/2 mm and 2%/2mm dose difference/ distance-to-tolerance criteria (DD/DTA) to check the quality the plan before starting the treatment .
Materials and methods: Ten complex Intensity Modulated Radiation Therapy (IMRT) (80 beams) plans for two different pathologies are calculated using the Eclipse Treatment Planning System (TPS), Pre-treatment verifications were performed for all patients plans by acquiring planar dose distributions of each treatment field with 2D-diode array Octavius 4D cylindrical phantom that is matrix composed of 1500 ionisation chambers with a size of 4.4 × 4.4× 3 mm3, whose centres are separated two by two by 7.07 mm. Measured dose and calculated dose were compared by using Gamma index method, and pass/failed test were generated foe each pair of planar doses using the following acceptance criteria 3%/3 mm, 3%/2 mm and 2%/2mm. During the pre-treatment verification we acquired the dose distribution with DICOM RT plan, RT stricter set, and RT dose file from TPS, and then we loaded all plans into the verisoft softwar to analyse each individual plan.
Results: Overall, a good correlation was observed between the measured and calculated doses in most of the beams with success agreement of the Gamma index for 3D analysis being 99% compared to 2D which was 97.11% for the 3%/3mm criterion. The average difference in the percentage of passing pixels between the 2D and 3D analyses ranged from 0.9% to 2%.
Keywords
Gamma Index, Octavius 4D, IMRT, QA
Introduction
Intensity Modulated Radiotherapy (IMRT) by modulating the beam intensity across each treatment field allows for better dose conformation particularly to concavely shaped contours of the target volume which is enough to control tumour cells, while reducing doses to normal tissues by modulating photon beam intensities by varying the Multi-Leaf Collimator (MLC) positions [1]. IMRT can produce highly conformal radiation dose distributions and enhance treatment localization. These complex treatment techniques also place higher demands on delivering dose treatment in terms of both accuracy and verification of treatment plans [2].
The verification of treatment plans in Intensity Modulated Radiation Therapy (IMRT) is focused on the linear accelerator and in particular the MultiLeaf Collimator (MLC). It involves evaluating and comparing the parameters of the treatment plans delivered by the linear accelerator with those planned. Complex treatment plans such as those developed in IMRT cannot be controlled by in vivo dosimetry. Verification in IMRT consisted mainly of the use of 2D measurements, but technological advances in medical physics have led to the use of new 3D measurement phantoms [1-3].
To control these types of treatments, more complex solutions are implemented, based on the use of a PTW Octavius 4D phantom by checking a Gamma index (γ) introduced by Low et al. [4]. In this case, a 4D system is used to carry out the verification of the treatment plans. The special feature of this system is that it allows a quick and direct analysis. The verification of the 3D measurement is an extension of the 2D measurement with another dimension, allowing later on an evaluation and verification of the volumetric distribution of the dose along the x, y and z axes to be taken into account by verifying the superposition of isodoses and profiles.
In this work we compared the measured dose distribution with the calculated dose distribution, the γ assessment method is adopted in this study, which quantifies both the absolute Dose Difference (DD) and the Distance-to-Tolerance Criteria (DTA) [5]. The DD represents the positional deviation between the two calculated and measured dose matrices [6]. DTA is used to compare doses in areas of high gradients, where only a deviation is of little interest, because a small positional deviation results in a large dose difference. The γ Index analysis is based on DTA and DD, and is designed to check regions of low and high dose gradient. This test is only successful when the DD and DTA criteria are all valid. This index is formulated so that when the value ≤ 1, the patient's plan is accepted and when the γ value is greater than one, the plan is rejected [7-8]. Thus, the γ index is a measure of the quality of the treatment plan that presents the percentage of dose points that meet the acceptance criteria [9].
The aim of this study is to ensure the quality of treatment plans by the IMRT using sophisticated analysis software such as Verisoft which offers many options such as γ index comparison.
Materials and Methods
We studied 10 patients from two localizations Head and Neck (HN) and Prostate treated at the Department of Radiotherapy, University Hospital Hassan II Fez in Morocco. HN localization was stabilized in supine position, with thermoplastic mask attached at five fixation points to a carbon-fiber plate support (CIVCO Radiotherapy Coralville, Iowa, USA). For Prostate cancer, we used a knee and foot support as immobilization device. CT simulation was performed in 3 mm slices using Siemens Somatom Sensation Open CT (Siemens, Erlangen, Germany).
In this work all the treatments were carried out with a Varian 2300 DHX linear accelerator (Varian, Palo Alto, CA, USA) equipped with a dynamic MLC, with a width of 1 cm projected at the isocentre. Two energies are available in the photon mode (6 MV and 18 MV). For the IMRT, 6 MV X-photons were used for Head and Neck tumours and prostate tumours. The calculation and optimisation of the dose were performed by an Eclipse treatment planning system using the Analytical Anisotropic Algorithm (AAA) (v.10.0.28).
The quality control checking the fluence is carried out with the help of an Octavius 4D phantom by PTW. This is a 2D matrix of ionisation chambers, which is inserted into a motorised homogeneous cylindrical phantom. The cylindrical phantom is made of acrylic with a density of 1.05 g/cm3. The system rotates synchronously with the rotation of the accelerator arm by using an inclinometer attached to the accelerator. This ensures that the beam incidence is always perpendicular to the plane detector inserted in the phantom (Figure 1).

Figure 1: Presentation of the LINAC phantom and the 2D Array
This matrix is composed of 1500 ionisation chambers with a size of (4.4 × 4.4 × 3) mm3, whose centres are separated two by two by 7.07 mm. The matrix therefore has 27 rows of 27 chambers.
Phantom Octavius Linac and Octavius CT
Two types of phantoms are used for the quality assurance of the treatment plans shown in Figure 2 by a slice section to observe their internal structure.

Figure 2: Internal view of the CT and LINAC phantoms
The CT phantom: This is a cylindrical phantom made of plastic materials equivalent to water with a density of 1.05 g/cm3. It has a rectangular opening and has a detector array or perforated inserts that can accommodate one or more cylindrical chambers.
The LINAC phantom: Also a cylindrical phantom with the same characteristics as the CT phantom with the difference that it also has a semi-cylindrical air cavity in its lower part to correct the non-water equivalence of the matrix.
The measurements are taken and sent to PTW's analysis software Verisoft V4.1. Calculation-measurement consistency is evaluated by the γ index test, proposed by Low, et al. [4] to perform a global analysis of a dose distribution. This γ index combines Dose Difference (DD) in % for low gradient areas and distance Distance-to-Tolerance criteria (DTA) in mm for high gradient areas.
Gamma index
The γ index is a comparison tool that takes into account both the difference in dose as well as the difference in distance between the two distributions. The principle is as follows: the calculated dose/measured dose difference is evaluated for each point. A deviation of less than 3% is considered acceptable. However, if the deviation is greater than 3%, the measurement software searches around the point in question for points that receive the same dose. If the distance between these points is less than 3 mm, this is considered correct. Overall, 95% of the pixels must meet these criteria for the treatment plan to be validated by the physicist (Figure 3). It gives a picture of the physical differences between the calculated and measured dose distributions [4, 10- 12]. The definition of the γ index is defined by the following equation:
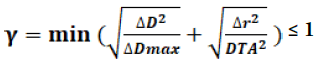

Figure 3: Evaluation principle of the Gamma function
• ΔDmax is the criterion that represents the maximum accepted dose difference in percentage (applied to regions with a low dose gradient).
• DTA (Distance-To-Agreement) is the criterion that represents the maximum accepted distance difference (applied to regions with a high dose gradient) in mm.
• Δr, the distance between the reference point and the measured point in mm.
• ΔD, the dose difference between the reference point and the measured point in %.
Results
The validation of treatment plans requires the comparison of calculating and measured dose distributions. Displaying a twodimensional distribution is the most commonly used methods. Qualitative validation is usually performed by superposing calculated and measured isodoses and profiles. Currently, analyses are performed on computers with sophisticated software called Verisoft, which offers many options such as γ index comparison.
Superposition
Superposition of isodoses: For the comparison of calculated and measured isodoses, it seems difficult to establish a quantitative verification criterion, so the results are quite qualitative. However, the superposition of the isodose lines was carried out by the dotted calculation and the measurement, which allows an immediate overview of the similarity of the two isodoses (calculation and measurement) with the help of verisoft software. The tools at our disposal allow us to superpose the results obtained in the three directions (Transversal, sagittal and coronal). In addition, the results of the comparison of isodose lines are shown in Figure 4.

Figure 4: Comparison of calculated and measured isodose lines for Transverse, sagittal and coronal planes
This strictly visual study makes it possible to show the good general correlation between the calculated and measured dose plans. Thus, deviations could be observed for certain isodoses (calculation and measurement) during the verification of superposition. These differences were due to a problem of dose rates. Sometimes, the speed of leafs failed to meet the modulation constraints imposed on the accelerator. This parameter is therefore to be considered if the correspondence is not adequate.
Superposition of profiles: Several profiles were measured by our Octavius 4D phantom to compare the profiles in order to validate treatment plans. Whatever the technique, the profiles measured in the transverse, sagittal, coronal and also diagonal planes are globally superposable with the calculated profiles. Our objective in this study was to show the capacity of the machine during the delivery of the treatment, but also to prove the feasibility of the controls with the Octavius 4D phantom. To illustrate this, below the dose profiles are presented comparing the calculation and the measurement profiles as shown in Figure 5.

Figure 5: Dose profiles for the transverse, coronal, sagittal and diagonal planes
NB: Calculated profile in blue and the measured profile in orange.
Overall, the calculated dose distribution is accurately measured with the Octavius 4D phantom. However, there may be differences between the calculated and measured profiles in several directions. It is therefore possible to quickly identify the areas most affected by significant errors. Above all, it is possible to differentiate the observed differences according to whether they appear in a high or low dose area or whether they are contained in high or low gradient. In this way the planning console calculates a smooth profile, which is certainly less correct than the measurement that it represents high gradients. Also on the superposition of two dose profiles, one can identify deviations in amplitude and deviations in distance. In this case, always check for resetting and normalization. If a discrepancy persists, then the Multi Leaf Collimator may be involved as shown in Figure 6.

Figure 6: Diagram of the overlap between the MLC of 5 mm and the ionisation chambers of the 2D-Array matrix for a collimator rotation of 0° and 30° degrees. The dotted line indicates the central axis
Other causes may be involved: the direction of movement of the blades, at the junction between two leaves, discrepancies are often observed between the calculation and the measurement. These differences are certainly due to the modelling of the leakage between leaves in the calculation algorithm.
Study of the Gamma (γ) index
The γ index provides a quantitative study or analysis of the correlation between the calculated and measured dose, the calculation of this index is based on the concept of Low [4]. Tables 2 and 3 show the results obtained in a population of ten patients planned with a 2D and 3D analysis. As an example, Figure 7 shows the results of the γ index analysis for the pass/fail test. This test displays images of the three planes (Transverse, Sagittal and Coronal) in which pixels with γ less than 1 are shown in green and pixels with γ greater than 1 in red and blue.

Figure 7: Results of a pass/fail test for the calculation of the γ index in a transverse, sagittal and coronal planes
We performed a comparison of the DD as well as the DTA for our 10 patients with malignant neoplasms using different criteria: 3%/3 mm, 3%/2 mm and 2%/2mm DD/DTA. The choice of these criteria was made to obtain and observe as much information as possible about the correlation between the calculated and measured dose plans. We then evaluated the DD between the doses delivered by the Varian machine and the dose predicted by the TPS.
When analysing the γ index for the pass/fail test, we obtained the following results for the 3%/3mm criterion: 97.11% and 99%. For the 3%/2mm criterion, the γ index results were 95.42% and 96.81%. For the last criterion of 2%/2mm, we found 92.01% and 93.66% of accepted points for 2D and 3D analysis respectively as shown in Tables 1 and 2. For all 10 patients considered, the γ index varied between 0.13 and 0.46; between 0.13 and 0.46; between 0.17 and 0.62 for the 3%/3mm, 3%/2mm and 2%/2mm criteria respectively as shown in Table 2.
| γ-index passing rates (%) | |||||||||
|---|---|---|---|---|---|---|---|---|---|
| 3%/3mm | 3%/2mm | 2%/2mm | |||||||
| P | Trans | Sagi | Coro | Trans | Sagi | Coro | Trans | Sagi | Coro |
| 1 | 97.2 | 95.9 | 96.5 | 97.8 | 94.6 | 95.7 | 94.7 | 90.7 | 91.1 |
| 2 | 97.6 | 95.4 | 96.2 | 97 | 93.3 | 94 | 94.5 | 87.7 | 89.5 |
| 3 | 96.8 | 96.7 | 96.8 | 94.2 | 94.2 | 95.4 | 90.5 | 89.1 | 91.2 |
| 4 | 98 | 97.7 | 98.74 | 97.6 | 96.6 | 95.3 | 95.8 | 93.1 | 92.7 |
| 5 | 97.7 | 96.7 | 96.4 | 96.3 | 94,2 | 93.8 | 94.1 | 86.4 | 89.6 |
| 6 | 97.2 | 97.2 | 97.3 | 95.5 | 95,7 | 94.9 | 92.4 | 90.9 | 91.6 |
| 7 | 97.7 | 97.8 | 97.9 | 97.1 | 97.2 | 97.8 | 95.8 | 96.8 | 95.1 |
| 8 | 97 | 96.6 | 96.6 | 91.4 | 93,1 | 94.2 | 91.1 | 90.4 | 91.2 |
| 9 | 97.5 | 96.3 | 95.7 | 95.1 | 94,7 | 92.9 | 90.5 | 90.5 | 89.5 |
| 10 | 98 | 98.2 | 97.9 | 97,2 | 96.8 | 96.2 | 93 | 95.5 | 95.2 |
| Mean | 97.47 | 96.85 | 97.00 | 95.78 | 95.45 | 95.02 | 93.24 | 91.11 | 91.67 |
| M(T,S,C) | 97.11 | 95.42 | 92.01 | ||||||
Tab. 1. Results of the γ-index success rate for a sample of 10 patients in our centre in 2D analysis.
| γ-index passing rates (%) | ||||||
|---|---|---|---|---|---|---|
| P | 3%/3mm | γ-index | 3%/2mm | γ-index | 2%/2mm | γ-index |
| 1 | 98.70 | 0.28 | 96.40 | 0.28 | 91.90 | 0.41 |
| 2 | 97.30 | 0.40 | 93.90 | 0.40 | 87.70 | 0.57 |
| 3 | 98.30 | 0.42 | 95.20 | 0.43 | 89 .9 | 0.60 |
| 4 | 99.60 | 0.34 | 98.10 | 0.39 | 95.10 | 0.55 |
| 5 | 99.10 | 0.46 | 95.90 | 0.46 | 91.30 | 0.62 |
| 6 | 99.40 | 0.38 | 97.20 | 0.38 | 93.40 | 0.55 |
| 7 | 99.80 | 0.09 | 99.40 | 0.09 | 98.80 | 0.11 |
| 8 | 99.10 | 0.32 | 96.10 | 0.32 | 92.60 | 0.47 |
| 9 | 98.90 | 0.28 | 96.70 | 0.28 | 93.70 | 0.43 |
| 10 | 99.80 | 0.13 | 99.20 | 0.13 | 98.40 | 0.17 |
| Mean | 99.00 | 0.31 | 96.81 | 0.31 | 93.66 | 0.45 |
Tab. 2. Results of the success rate in % and the γ-index values obtained when comparing the calculated and measured plans for a sample of 10 Patients in our center with 3D analysis.
These results show that quantitatively, the use of the Octavius 4D Phantom allows a better comparison between calculation and measurement. Indeed, the results obtained with the 3%3mm criterion are perfectly comparable to those obtained with the TPS.
Discussion
In this study, a criterion of 3%/3mm was established as a standard for verification of intensity modulated treatment plans based on a γ index [13-15]. We presented the results of the γ index assessment for IMRT treatment, according to the 3%/3mm, 3%/2mm and 2%/2mm criteria. The γ assessment with 3%/3mm has been successfully applied for patient-specific quality assurance before treatment in our institution for two years.
Several studies have recently shown that the percentages of accepted points in the 2D γ Index test are not relevant, in contrast to the 3D dose parameters [16,17]. The information from the 2D γ assessment is not sufficient to detect errors in the administered doses that are 3D in the patient's body [18]. Furthermore, γ evaluation is a comprehensive tool for checking the whole plan and not the doses delivered to each organ individually, the accuracy of dose delivery to each structure, including target volumes and OAR, cannot be checked individually with γ evaluation [19].
However, as initial measurements and quality assurance of the treatment plans showed that the MLC movements were larger than expected, it is necessary to find conditions that meet the standard γ index criterion in line with other studies that have analyzed the sensitivity of IMRT with γ indices of 3%/3 mm, 3%/2 mm and 2%/2 mm [20]. Thus, the various DD and DTA controls were performed to see to what extent the criteria could be reduced to simultaneously achieve a success rate of more than 97% for IMRT treatments and still be strict enough to allow for the containment of execution errors of plans that do not meet the selected γ index criteria.
In the present study, we compared the results of the 2D and 3D analysis for a variety of DD and DTA criteria. For all parameters assessed, the differences between the 2D and 3D results were slightly different. In terms of average, in all conditions evaluated in this study, the percentage of success for a 3D analysis was 99% compared to 2D which was 97.11% of pixels for the γ index. On the other hand, larger analysis errors were expected in the 2D results than in 3D because the 2D analysis is more sensitive to dose gradients perpendicular to the measurement plane (as there is no data above and below the plane to allow for a DTA analysis to compensate for these errors in that dimension). This would result in an even greater difference between the γ index in 2D and 3D, as shown by Sanghangthum, et al. [21] for IMRT treatment plans. Although the literature and current clinical practice indicate that γ measurement success rate, whether in 2D or 3D form, is commonly used for routine IMRT QA, it should be noted that the literature raises the question of whether or not γ measurement success rate alone is useful in IMRT QA for detecting plan errors. Indeed, two independent studies by Kruse [22] and Nelms, et al. [23] have shown that 2D γ measurement has a low sensitivity for detecting clinically relevant plan errors.
Our study also shows another problem with current QA practices in IMRT, namely the higher γ index success rate associated with the low dose thresholds commonly used by the medical physics community. A survey of QA practices in IMRT by Nelms and Simon [24] showed that all responding facilities used a low dose threshold between 0 and 15%, most commonly a low dose threshold of 5-10%. These low-dose thresholds include a large number of low-dose pixels, which may result in an inflated pass rate when assessed using an overall dose difference criterion. This is consistent with our results which showed an increasing pass rate for 2D and 3D γ with a decreasing low dose threshold (2D and 3D being 95.2% and 97.1% with a low dose threshold of 15%, compared to 98.06% and 99% with a threshold of 5%).
In general, there are many differences between planar and volumetric analysis for checking treatment plans. Individual plans in 2D analysis may miss problems that would be identified with 3D analysis, but may also highlight areas where problems exist.
Conclusion
Before the start of treatment of each new patient with intensity modulated conformal radiotherapy, a time slot is set aside to validate the dosimetry, and to ensure a good correlation between calculation and measurement [25]. Based on the results of the evaluation, we conclude that the Octavius 4D System is a suitable device for patient-specific quality assurance. The ability of the system to reconstruct the volumetric dose distribution in the phantom provides additional information compared to conventional 2D detectors [26].
The results obtained confirm its ability to assure the quality of intensity modulated beams. The results of the correlation between the calculated and measured planes, i.e. the γ analysis results, indicate that the Octavius 4D Systems has a better correlation between the planes (calculated and measured) as well as with the volumetric γ analysis pass rates. This system allows for a quantitative assessment of design complexity and can provide more information on treatment delivery and control of beam parameters such as arm rotation and blade speed. This could be useful throughout the treatment planning and quality assurance process. Finally, it appears that the Octavius 4D is fast and reliable and still has a very important role to play in patient management.
References
- Elmpt W, Sebastiaan N, Mijhnheer B, Dekker A, Lambin P. “The next step in patient-specific QA: 3D dose verification of conformal and intensity-modulated RT based on EPID dosimetry and Monte Carlo dose calculations,” Radiother Oncol. 2008;86:86-92.
- Ansbacher W .“Three-dimensional portal image-based dose reconstruction in a virtual phantom for rapid evaluation of IMRT plans”. Med Phys.2006; 33:3369-3382.
- Mans A, Remeijer P, Olaciregui-Ruiz I, Wendling M, Sonke J, et al. “3D dosimetric verification of volumetric-modulated arc therapy by portal dosimetry.” Radiat Oncol. 2010;94:181-187.
- Low DA, Harms WB, Mutic S, and Purdy JA. “A technique for the quantitative evaluation of dose distributions,” Med Phys. 1998;25:656-661.
- Mijheer B, Georg D. Guidelines for the verification of IMRT. Brussels, Belgium. ESTRO; 2008.
- Depuydt T, Van Esch A, Huyskens DP. A quantitative evaluation of IMRT dose distributions: refinement and clinical assessment of the gamma evaluation. Radiother Oncol. 2002;62:309-319.
- Tonigan JR. Evaluation of intensity modulated radiation therapy (IMRT) delivery error due to IMRT treatment plan complexity and improperly matched dosimetry data. MSc Thesis. The University of Texas. Houston, Texas. 2011.
- Varatharaj C, Ravikumar M, Sathiyan S, Supe s, Vivek TR, et al. Dosimetric verification of brain and head and neck intensity-modulated radiation therapy treatment using EDR2 films and 2D ion chamber array matrix. J Cancer Res Ther. 2010;6:179-184.
- Stasi M, Bresciani S, Miranti A, Maggio A, Sapino V, et al. Pretreatment patient‐specific IMRT quality assurance: A correlation study between gamma index and patient clinical dose volume histogram. Med Phys. 2012;39:7626-7634.
- Harms W, Low D, Wong J, Purdy JA. A software tool for the quantitative evaluation of 3D dose calculation algorithms. Med Phys. 1998;25:1860-1866.
- Stock M, Kroupa B, Georg D. Interpretation and evaluation of the gamma index and the gamma index angle for the verification of IMRT hybrid plans. Phys Med Biol. 2005;50:399-411.
- Depuydt T, Van Esch A, Huyskens D. A quantitative evaluation of IMRT dose distributions: refinement and clinical assessment of the gamma evaluation. Radiother Oncol. 2002;62;309-319.
- Korreman S, Medin J, Kjaer-Kristoffersen F. “Dosimetric verification of RapidArc treatment delivery.” Acta Oncol. 2009;48:185-191.
- JBedford JL , Warrington AP. “Commissioning of volumetric modulated arc therapy (VMAT).” Int. J Radiat Oncol Biol Phys. 2009;73:537-545.
- Iftimia I, Cirino ET, Xiong L, Mower HW. “Quality assurance methodology for Varian RapidArc treatment plans.” J Appl Clin Med Phys. 2010;11:130-143.
- Jin X, Yan H, Han C, Zhou Y, Yi J, et al. Correlation between gamma index passing rate and clinical dosimetric difference for pre-treatment 2D and 3D volumetric modulated arc therapy dosimetric verification. Br J Radiol. 2015;88:20140577.
- Nelms BE, Zhen H, Tome WA. Per-beam, planar IMRT QA passing rates do not predict clinically relevant patient dose errors. Med Phys. 2011;38:1037-1044.
- Kim JI, Choi CH, Wu HG, Kim JH, Kim K, et al. Correlation analysis between 2D and quasi-3D gamma evaluations for both intensity-modulated radiation therapy and volumetric modulated arc therapy. Oncotarget. 2017;8:5449-5459.
- Park JM, Park SY, Kim H. Modulation index for VMAT considering both mechanical and dose calculation uncertainties. Phys Med Biol. 2015;60:7101-7125.
- Yan G, Liu C, Simon TA, Peng LC, Fox C, et al. “On the insensitivity of patient-specific IMRT QA to MLC positioning errors.” J Appl Clin Med Phys. 2009;10:120-128.
- Sanghangthum T, Suriyapee S, Srisatit S, Pawlicki T, “Statistical process control analysis for patient-specific IMRT and VMAT QA.” J Radiat Res. 2013;54:546-552.
- Kruse J. “On the insensitivity of single field planar dosimetry to IMRT inaccuracies.” Med Phys. 2010;37:2516-2524.
- Nelms BE, Zhen H, Wolfgang T, “Per-bam planar IMRT QA passing rates do not predict clinically relevant patient dose errors.” Med Phys. 2011;38:1037-1044.
- Nelms BE, Simon JA, “A survey on planar IMRT QA analysis.” J Appl Clin Med Phys. 2007;8:76-90.
- Marcié S, Aletti P, Lefkopoulos P, Tomsej M, Participation of physicists. Quality assurance program for intensity-modulated radiotherapy (IMRT) treatments of head and neck carcinomas. Cancer Radiother. 2003;7:172-178.
- Dhanabalan R, Prakash J, Prabakar S, Rangnathan A, Johnjothi S, et al. A study on the correlation between plan complexity and gamma index analysis in patient specific quality assurance of volumetric modulated arc therapy. Rep Pract Oncol Radiother. 2014;20:57-65.


