Research Article - Onkologia i Radioterapia ( 2022) Volume 16, Issue 8
Two-layer deep feature fusion for detection of breast cancer using thermography images
Ankita Patra1, Santi Kumari Behera2, Nalini Kanta Barpanda1 and Prabira Kumar Sethy1*2Department of Computer Science and Engineering, VSSUT, Burla, India
Prabira Kumar Sethy, Department of Electronics, Sambalpur University, Jyoti Vihar, Burla-768019, India, Email: prabirsethy.05@gmail.com
Received: 12-Jul-2022, Manuscript No. OAR-22-69126; Accepted: 06-Aug-2022, Pre QC No. OAR-22-69126(PQ); Editor assigned: 14-Jul-2022, Pre QC No. OAR-22-69126(PQ); Reviewed: 28-Jul-2022, QC No. OAR-22-69126(Q); Revised: 30-Jul-2022, Manuscript No. OAR-22-69126(R); Published: 07-Aug-2022
Abstract
Breast cancer is one of the leading causes of death for women worldwide. Deep convolutional neural network-supported breast thermography is anticipated to contribute substantially to early detection and facilitate therapy at an early stage. This study aims to examine how several cutting-edge deep learning techniques with feature fusion behave when used to detect breast cancer. The effectiveness of the two-layer fusion of AlexNet, vgg16, and vgg19 for detecting breast cancer using thermal images is assessed. With feature fusion of fc6 and fc8, VGG16 outperformed AlexNet andVGG19 among the three CNN models in all three bi-layer fusion combinations, achieving an accuracy of 99.62.
Keywords
breast cancer, thermal images, two-layer feature fusion, deep features, CNN
Introduction
Breast Cancer (BC) is the most common cancer in women. Cancer is an uncontrolled cell growth problem that causes tumour formation, spreads to neighbouring tissues, and metastasizes. The body naturally governs cell production, growth, and death. Exposure to ultraviolet radiation, smoking, age, genetic predisposition, and an unhealthy lifestyle may raise the risk of cancer [1]. Ducts link normal breast glands to the skin. Connective tissue embeds blood arteries, lymph nodes, lymph channels, and nerves around glands and ducts. More than 20 forms of BC have been identified [2]. The most common BCs are ductal carcinoma and lobular carcinoma [3]. Breast thermography helps diagnose BC [4]. It uses breast pictures to diagnose early-stage BC. Breast thermography uses chemical and blood vessel activity in precancerous tissue to keep existing blood vessels open and generate new ones (neo-angiogenesis) [5]. This raises breast temperature. Breast thermography detects temperature changes in the breast using an infrared camera and computer [6]. Many studies have focused on diagnosing BC using Thermal Imaging (TI) based on temperature variations (colours) [7].
A method is proposed [8] to detect the immunohistochemical response to BC by detecting thermal heterogeneity in the targeted area. With 208 women participating, this study examined the normal and abnormal (as determined by mammography or clinical diagnosis) conditions of BC screening. The ResNet-50 pre-trained model was used to extract high-dimensional deep thermomic features from a low-rank thermal matrix approximation using sparse principal component analysis. This is then reduced to 16 latent space thermomic features by a sparse deep autoencoder designed and trained for such data. The participants were classified using a random forest model. An accuracy of 78.16% (73.3%–81.0%) can be achieved using the proposed method, which preserves thermal heterogeneity. Again, convex non-negative matrix factorization (convex NMF) was used by [9] to identify the three most common thermal sequences.
A Sparse Auto Encoder Model (SPAER) was utilized to extract low-dimensional deep thermomics from the data, which were then incorporated into the clinical breast exam (CBE) to identify early signs of BC. 79.3% (73.5%, 86.9%) were obtained using convex NMF- SPAER, which combined clinical and demographic factors. NMF-SPAER had the highest percentage of success, at 84.9% (79.3%, 88.7%). Fully automated BC detection was proposed by [10]. The proposed method is comprised of three stages. Before computing, thermal pictures are reduced in size to speed up the overall process. U-Net network is used to extract the breast region automatically. Lastly, a two-class CNN-based deep learning model for categorizing normal and pathological breast tissue is suggested, trained from scratch, and evaluated. Based on the experimental findings, the proposed model had an accuracy of 99.33%, a sensitivity of 100%, and a specificity of 98.67%. A thermogram-based BC detection method is offered by [11]. There are four stages to this method: Homomorphic filtering, top-hat transform, and adaptive histogram equalization were used for image preprocessing, followed by ROI segmentation using binary masking and K-mean clustering, feature extraction using signature boundary, and classification using Extreme Learning Machine (ELM) and Multilayer Perceptron (MLP) classifiers, respectively. The DMR-IR dataset is used to test the suggested methodology. For example, the integration of geometrical feature extraction and textural feature extraction was assessed using a variety of metrics (i.e., accuracy, sensitivity, and specificity). ELM-based results outperformed MLP-based results by a margin of more than 19%. BC detection and screening using thermal imaging are made possible by the use of artificial intelligence [12]. Using self-organizing neural networks, data from a TI of a patient is first clustered. To begin with, suspicious spots are identified in the image. Results from this stage are employed in an algorithm similar to the basic algorithm (self-organizing map algorithm of primary proposed). Still, it has different criteria to extract diagnostic features for screening. A multi-layer perceptron neural network incorporates these details to round out the screening process. Two 200-case bases and one 50-case base are the photos under consideration for testing. One base has a sensitivity of 88%, while the other has a sensitivity of 100% (accuracy=98.5%). Mammograms were used to diagnose cancer in 15 cases and two in the latter group.
The literature shows that most researchers use machine learning, especially deep learning techniques, for detecting BC using TIs. But, no one employed the feature fusion techniques of CNN for BC detection. The feature fusion has the most remarkable advantage: it can generate high dimension feature vectors from a small dataset.
Material and Methodology
This section described the dataset and adapted methodology.
Dataset
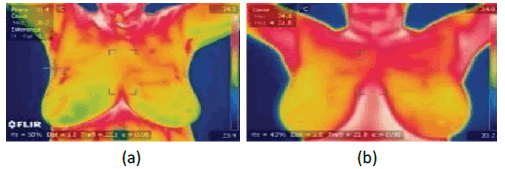
The TIs are collected from the DMR-IR benchmark database, accessible through a user-friendly online interface (http://visual. ic.uff.br/dmi), and used for experiments. The dataset contains sick and healthy images. Here, 250 images of each category are collected. The images are of size 640×480. The sample images are illustrated in Figure 1.
Figure 1: Image of the breast thermal image (a) sick (b) healthy
Methodology
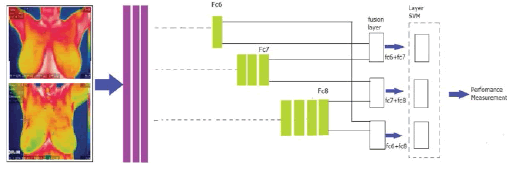
The task of identifying cancer cells in breast tissue is fraught with difficulties. Traditional methods necessitate a high level of skill and are prone to errors. Deep learning approaches can help solve some of these challenges and give easy and effective ways to recognize BC Cells. On the other hand, existing procedures primarily exploit BC cell features under a microscope and emphasize a manual feature extraction pipeline. Deep learning with bi-layer feature fusion uses specimen photos to recognize BC cells in breast tissue images. AlexNet, vgg16, and vgg19 have fc6, fc7, and fc8 feature layers. Other models include only one feature layer, except for these three pre-trained CNN models. As a result, only AlexNet, vgg16, and vgg19 support multi-layer feature fusion. On AlexNet, vgg16, and vgg19, bi-layer feature fusion is demonstrated with various feature combinations.
With the introduction of the above-proposed framework, (Figure 2) nine possible classification models have resulted. The possible bi-layer feature fusions are fc6+fc7, fc7+fc8 and fc6+fc8. Further, these three feature fusions are applied to Alexnet, VGG16, and VGG19.So, there are nine classification models for the recognition of minerals. The fc6 and fc7 have 4096 features, and fc8 has 1000 features. After fusion of the twolayer, the resulting feature vector's dimension is enhanced. The fc6+fc7 have 4096+4096=8192, fc7+fc8 have 4096+1000=5096 and fc6+fc8 have 4096+1000=5096 number of features. For enhanced feature vector is fed to SVM for classification.
Figure 2: Bi-layer feature fusion approach for BC detection using thermal images
Result and Discussions
The proposed framework for BC detection using TIs is executed in core i7, Windows 10, and 8GB RAM in the MATLAB 2021a platform. The performance of all nine classification models is evaluated in terms of accuracy, sensitivity, specificity, precision, FPR, F1 score, MCC, and kappa score. The performance of AlexNet, vgg16, and vgg19 in three combinations of feature fusion, i.e., fc6+fc7, fc7+fc8, and fc6+fc8, are recorded in Table 1.
Tab. 1. Performance of classification models in bi-layer feature fusion approaches.
| Confusion | Fc6+Fc7 | Fc7+Fc8 | Fc6+Fc8 | ||||||
|---|---|---|---|---|---|---|---|---|---|
| Matrix Measures | AlexNet | Vgg16 | Vgg19 | AlexNet | Vgg16 | Vgg19 | AlexNet | Vgg16 | Vgg19 |
| Accuracy | 0.9923 | 0.9808 | 0.9885 | 0.9769 | 0.9346 | 0.9577 | 0.9923 | 0.9962 | 0.9846 |
| Sensitivity | 1 | 1 | 1 | 0.9923 | 1 | 0.9462 | 1 | 1 | 1 |
| Specificity | 0.9846 | 0.9615 | 0.9769 | 0.9615 | 0.8692 | 0.9692 | 0.9846 | 0.9923 | 0.9692 |
| Precision | 0.9848 | 0.963 | 0.9774 | 0.9627 | 0.8844 | 0.9685 | 0.9848 | 0.9924 | 0.9701 |
| FPR | 0.0154 | 0.0385 | 0.0231 | 0.0385 | 0.1308 | 0.0308 | 0.0154 | 0.0077 | 0.0308 |
| FI Score | 0.9924 | 0.9811 | 0.9886 | 0.9773 | 0.9386 | 0.9572 | 0.9924 | 0.9962 | 0.9848 |
| MCC | 0.9847 | 0.9623 | 0.9772 | 0.9543 | 0.8768 | 0.9156 | 0.9847 | 0.9923 | 0.9697 |
| Kappa | 0.9846 | 0.9615 | 0.9769 | 0.9538 | 0.8692 | 0.9154 | 0.9846 | 0.9923 | 0.9692 |
It is observed from Table 1 that the bi-layer fusion of fc6+fc7 performed better compared to fc7+fc8 and fc6+fc8. Again, among three CNN models in all three bi-layer fusion combinations, VGG16 is better than AlexNet and VGG19.
Further, the confusion matrix of all possible nine classification models is illustrated. Figure 3 shows the confusion matrix resulting from the bilayer fusion, i.e., fc6+fc7; similarly, Figure 4 and Figure 5 show the resulting confusion matrix of bi-layer fusion of fc7+fc8 and fc6+fc8, respectively. Overall, using TIs, the VGG16 with fc6+fc8 performed well for BC detection.
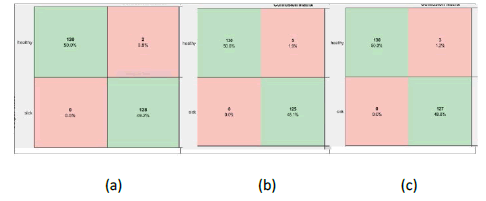
Figure 3: Confusion matrixes of bi-layer fusion of fc6 and fc7 (a) AlexNet (b) VGG16 (c) VGG19
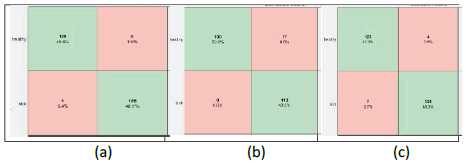
Figure 4: Confusion matrixes of bi-layer fusion of fc7 and fc8 (a) Alexnet (b) VGG16 (c)VGG19
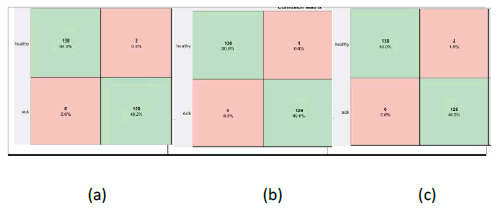
Figure 5: Confusion matrixes of bi-layer fusion of fc6 and fc8 (a) Alexnet (b) VGG16 (c) VGG19
Conclusion
The convolution neural network plays a vital role in detecting BC. Here, an automated solution is provided to detect BC using TIs. The bi-layer feature fusion technique is adapted to improve accuracy by enhancing the feature vector dimension. The performance of three bi- layer feature fusion, i.e., fc6+fc7, fc7+fc8, and fc6+fc8, in three CNN models, i.e., VGG16, AlexNet, and VGG19 are carried out. The VGG16 with feature fusion of fc6+fc8 provides the best result with an accuracy of 99.62%.
References
- Doll R, Peto R. The causes of cancer: quantitative estimates of avoidable risks of cancer in the United States today. JNCI: J Natl Cancer Inst.1981;66:1192-1308.
- Rajinikanth V, Kadry S, Taniar D, DamaÅ¡eviÄius R, Rauf HT. Breast-cancer detection using thermal images with marine-predators-algorithm selected features. IEEE.:1-6.
- Mishra S, Prakash A, Roy SK, Sharan P, Mathur N. Breast cancer detection using thermal images and deep learning. IEEE.2020:211-216.
- Mambou SJ, Maresova P, Krejcar O, Selamat A, Kuca K. Breast cancer detection using infrared thermal imaging and a deep learning model. Sensors.2018;18:2799.
- Roslidar R, Rahman A, Muharar R, Syahputra MR, et al. A review on recent progress in thermal imaging and deep learning approaches for breast cancer detection. IEEE Access. 2020;8:116176-116194.
- Wolff AC, Hammond ME, Schwartz JN, Hagerty KL, Allred DC, et al. American Society of Clinical Oncology/College of American pathologists guideline recommendations for human epidermal growth factor receptor 2 testing in breast cancer. Arch Pathol Lab Med. 2007;131:18-43.
- Kennedy DA, Lee T, Seely D. A comparative review of thermography as a breast cancer screening technique. Integr Cancer Ther. 2009;8:9-16.
- Yousefi B, Akbari H, Maldague XP. Detecting vasodilation as a potential diagnostic biomarker in breast cancer using deep learning-driven thermomics. Biosensors. 2020;10:164.
- Yousefi B, Hershman M, Fernandes HC, Maldague XP. Concentrated Thermomics for Early Diagnosis of Breast Cancer. Eng Proc.2021;8:30.
- Mohamed EA, Rashed EA, Gaber T, Karam O. Deep learning model for fully automated breast cancer detection system from thermograms.Plos one.2022;17:e0262349.
- AlFayez F, El-Soud MW, Gaber T. Thermogram Breast Cancer Detection: a comparative study of two machine learning techniques. Appl Sci.2020;10:551.
- Ghayoumi Zadeh H, Montazeri A, Abaspur Kazerouni I, Haddadnia J. Clustering and screening for breast cancer on thermal images using a combination of SOM and MLP. Comput Methods Biomech Biomed Eng: Imaging Vis. 2017;5:68-76.
