Research Article - Onkologia i Radioterapia ( 2023) Volume 17, Issue 4
Prediction of breast cancer using tools of machine learning techniques
Madhumita Pal1, Smita Parija2* and Ganapati Panda22Department of Electronics and Telecommunication Engineering, C V Raman Global University, Odisha, India
Smita Parija, Department of Electronics and Telecommunication Engineering, C V Raman Global University, Odisha, India, Email: SPARIJA@CVRCE.EDU.IN
Received: 24-Feb-2023, Manuscript No. OAR-23-95026; Accepted: 20-Apr-2023, Pre QC No. OAR-23-95026 (PQ); Editor assigned: 01-Mar-0202, Pre QC No. OAR-23-95026 (PQ); Reviewed: 15-Mar-2023, QC No. OAR-23-95026 (Q); Revised: 31-Mar-2023, Manuscript No. OAR-23-95026 (R); Published: 28-Apr-2023
Abstract
Objective: Machine learning techniques have been shown to support multiple medical prognoses. The purpose of this article is to compare some machine learning techniques to compare the diagnosis of breast cancer (cancerous and non-cancerous) using the inputs from five supervised machine learning approaches through the different feature selections to get a correct result.
Materials and methods: This study included 683 cases of breast cancer, four hundred and forty-four being benign and two hundred and thirty-nine malignant; the studied data were taken from the UCI machine learning repository. Ten models for machine learning were evaluated and only five were selected from the correlation matrix (SVC, logistic regression, random forests, XGBoost or K-NNs).
Results: Random forests and the K-NNs model predict the most significant true positives among the five techniques. In addition, SVC and RFs models predict the most significant number of true negatives and the lowest number of false negatives. The SVC obtains the highest specificity of 96% and the XGB obtains the lowest specificity of 92.3%.
Conclusion: From this study, it is concluded that the random forests and K-NN machine leaning models are the most suitable models for breast cancer diagnosis with an accuracy rate greater than 95%.
Keywords
machine learning, breast cancer, benign, malignant
Introduction
Breast cancer is caused by the abnormal development of cells in the breast and is the most common cancer globally. There is no evading the main issue about breast cancer; it is the mainly common form of cancer in India, with cervical cancer obsolete. In cities like Bengaluru, Mumbai, Delhi, Kolkata, Bhopal, Ahmedabad, Chennai, breast cancer accounts for 25% to 32% of all cancers in women, more than a quarter of all cancers in women. Younger age groups (25-50) are very often affected these days and the worst news is that more than 70% of advanced cases have had poor survival and high death rates. A recent report from the Indian council for medical research assumed the breast cancer count is likely to rise to 18.3 lakhs in 2022 [1].
Various techniques have been introduced to diagnose breast cancer (BSE, mammography, ultrasound, MRI and positron emission tomography). However, every technique has some loop holes. Breast Self Examination (BSE) is effective when done regularly but fails due to the patient's inability to check for changes in the early stages. Mammography is used to examine a woman's breasts through X-rays. In general, due to the small size of the cancer cells, it is almost impossible to detect breast cancer from the outside. Ultrasound is a well-known technique using sound waves to diagnose breast cancer [2]. However, a transducer that emits false sound waves due to ambient noise makes a correct diagnosis more difficult. Positron Emission Tomography (PET) imaging using F-fluorodeoxyglucose is based on detecting radioactively labeled cancer-specific tracers. However, the majority of patients cannot afford the cost of PET, so it has disadvantages. Dynamic Magnetic Resonance Imaging (MRI) predicts the rate of contrast enhancement using the breast distortion detection method by increasing angiogenesis in cancer [3].
Vast amounts of diagnostic data are available on behalf of the dataset through numerous websites around the world. The dataset was created by compiling data from various hospitals, diagnostic centers and research centers. They hardly need to be organized so that the system can diagnose diseases quickly and automatically. Diagnosing a disease is usually based on medical plotter information and skills in the medical field (Improving diagnosis in health care [4]. Washington (DC): National academies press (US)). Human error affects unwanted prejudices, wrong circumstances that later delay the accurate diagnosis of the disease. Enlightened by various disadvantages of the various techniques, additional techniques are needed to confirm the existing technology’s findings, which will help the physician make the right decision. So this study tried to minimize the gap between doctors and the technologies available to them to make the right decisions through the concept of machine learning [5]. Accurately diagnosing critical information in medicine is a need of the hour and is possible through bioinformatics or machine learning since diagnosing the disease is a vital and tricky task in the medical field. Machine learning techniques have been shown to support multiple medical prognoses. The purpose of this article is to compare some machine learning techniques to compare the diagnosis of breast cancer (cancerous and noncancerous) using the inputs from five supervised machine learning approaches through the different feature selections to get a correct result [6].
Materials and Methods
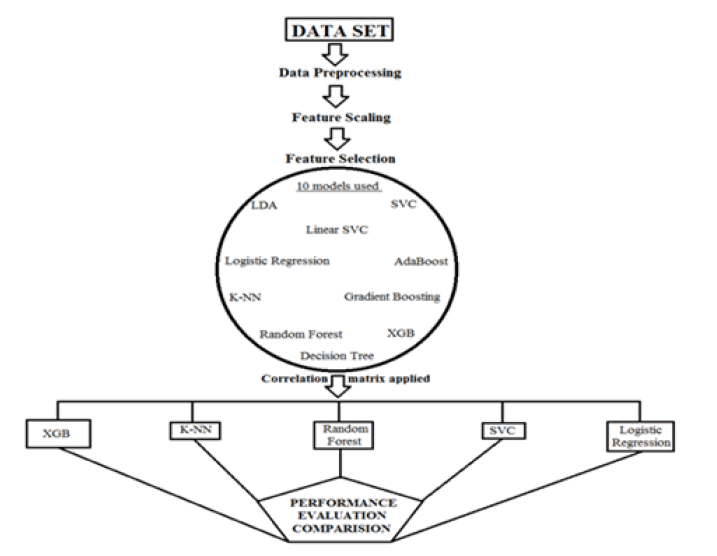
This study included 683 cases of breast cancer, four hundred and forty-four being benign and two hundred and thirty-nine malignant. The data set was taken from the UCI machine learning repository. The feature data record consists of nine characteristics and one class attribute; after inserting the sample code number, it is eleven attributes. All attributes have an integer data type in the range from 1 to 10 (Table 1). The data set identifies whether the patient's breast tissue is malignant or benign. Flow diagram of the study described in Figure 1. Ten models for machine learning were evaluated and only five were selected from the correlation matrix (Support vector clustering, logistic regression, random forests, extreme gradient boost and Knearest neighbor) [7].
Tab. 1. Description of breast cancer dataset
| Number | Attribute name | Domain | Missing value |
|---|---|---|---|
| 1 | Clump thickness | 1-10 | 0 |
| 2 | Uniformity of cell size | 1-10 | 0 |
| 3 | Uniformity of cell shape | 1-10 | 0 |
| 4 | Marginal adhesion | 1-10 | 0 |
| 5 | Single epithelial cell size | 1-10 | 0 |
| 6 | Bare nucleoli | 1-10 | 0 |
| 7 | Bland chromatin | 1-10 | 0 |
| 8 | Normal nucleoli | 1-10 | 0 |
| 9 | Mitosis | 1-10 | 0 |
| 10 | Sample code number | 1-10 | 0 |
| 11 | Class | 2 for benign, 4 for malignant | 0 |
Figure 1: Flow diagram of the study
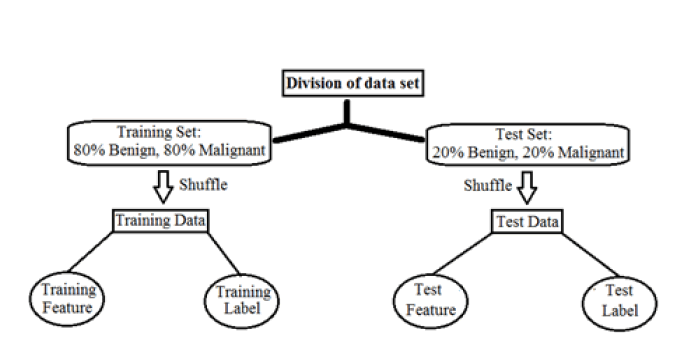
Preprocessing: Two independent sets have been classified according to preprocessing data; these names are the training set and test set. These are very important to facilitate machine learning techniques. The data set is further broken down according to the type of breast cancer; benign and malignant cases are weighed. The preprocessing flowchart is shown in Figure 2. Before training or testing, the feature data is mixed with passing patient cases to the machine learning techniques in random order. Machine learning accuracy is performed in two training set and 20% of the same group are used in the test set [8]. Then all marked data, M=malignant and B=benign, are used for supervised learning in all machine learning techniques. Since the original feature data also cover a wide range; the accuracy of machine learning methods can be improved by performing data normalization for all feature data. The minimum-maximum normalization can also accelerate the convergence of machine learning techniques.
Figure 2: Pre-processing flowchart
Support vector clustering: The objective of clustering is to partition a data set into groups according to some decisive element in an effort to systematize data into a more meaningful form. Clustering may advance according to some parametric model or by classifying points according to some distance or resemblance measure as in hierarchical clustering [9]. A natural way to put cluster boundaries is in areas in data space where there is little data, i.e., in valleys in the likelihood distribution of the data.
Logistic regression: The likelihood of a level is related to a number of explanatory variables in logistic regression and analytical modeling techniques. It is used to examine a data set in which one or more independent variables influence the outcome. First, a binary variable is used to measure the outcome (with only two possible outcomes).
Then, a number of independent variables are used to predict a binary outcome (true/false, 1/0, yes/no). The LR model is represented by the following equations: Where x is the participation size of the illustrative variable xi (I=1, ..., n) and ci is the regression coefficient most likely to be obtained concerning its common errors [10].
Random forests: It is a supervised learning algorithm rule used in each category for regression. However, it is mainly used to solve categorization difficulties. As we all know, forests are made up of trees and having many trees means having many solid forests. Similarly, the random forest algorithm principles build a decision tree for the knowledge samples to collect predictions from each sample and then vote on the most straightforward. Since it can reduce overfitting by averaging the results, it is a better correlation integration strategy than a decision tree.
Extreme gradient boosting: Extreme gradient boosting (XGBoost) is an efficient and effective accomplishment of the gradient boosting algorithm, which refers to a class of ensemble machine learning algorithms that can be used for classification or regression predictive modeling problems. The loss gradient is minimized when the model is adapted, similar to a neural network.
K-NN: The K-Nearest Neighbor (K-NN) algorithm is widely used in predictive analysis and also for grouping and pattern identification. Any highly varying attribute can have a significant impact on the interval between data points, as it recognizes existing data points that are closest to the new data. The set is first described by K's neighbors in the classification phase. At this point the computation finds the K neighboring neighbors of the new data sample that is the most regular of the K training samples. Since all data points are in metric space, calculating the distance is a major challenge [11].
If N in K-NNs stands for the number of neighbors, then N samples with the following distance metric value are considered: Where p=1 manhattan indicates distance, p=2 indicates the euclidean distance and p=0 indicates the chebyshev distance. Euclidean distance is the most widely used of the many options. The computation then examines the amount of information concentrated on each class among these K neighbors and assigns the new information point to the classification.
Results and Discussion
With the development of medical research, machine learning techniques for detecting breast cancer have been developed. The confusion matrix of all models is calculated for clarity of the techniques. The confusion matrix of the machine learning strategies used is shown in Tables 2-6, which provide the prediction results of SVC, logistic regression, random forests, XGBoost and K-NNs, respectively.
Tab. 2. Classification report of support vector clustering
| Precision | Recall | F1-score | Support | |
|---|---|---|---|---|
| Benign | 1.0 | 0.94 | 0.97 | 87 |
| Malignant | 0.91 | 1.00 | 0.95 | 50 |
| Accuracy | 0.96 | 137 | ||
| Macro avg | 0.95 | 0.97 | 0.96 | 137 |
| Weighted avg | 0.97 | 0.96 | 0.96 | 137 |
Accuracy is 0.9635036496350365
Tab. 3. Classification report of logistic regression
| Precision | Recall | F1-score | Support | |
|---|---|---|---|---|
| Benign | 0.95 | 0.99 | 0.97 | 87 |
| Malignant | 0.98 | 0.90 | 0.94 | 50 |
| Accuracy | 0.96 | 137 | ||
| Macro avg | 0.96 | 0.94 | 0.95 | 137 |
| Weighted avg | 0.96 | 0.96 | 0.96 | 137 |
Accuracy is 0.9562043795620438
Tab. 4. Classification report of random forests
| Precision | Recall | F1-score | Support | |
|---|---|---|---|---|
| Benign | 0.97 | 0.99 | 0.98 | 87 |
| Malignant | 0.98 | 0.94 | 0.96 | 50 |
| Accuracy | 0.97 | 137 | ||
| Macro avg | 0.97 | 0.96 | 0.97 | 137 |
| Weighted avg | 0.97 | 0.97 | 0.97 | 137 |
Accuracy is 0.9708029197080292
Tab. 5. Classification report of extreme gradient boosting
| Precision | Recall | F1-score | Support | |
|---|---|---|---|---|
| Benign | 0.9 | 0.99 | 0.94 | 79 |
| Malignant | 0.98 | 0.84 | 0.91 | 58 |
| Accuracy | 0.93 | 137 | ||
| Macro avg | 0.94 | 0.92 | 0.92 | 137 |
| Weighted avg | 0.93 | 0.93 | 0.93 | 137 |
Training score: 96.15384615384616; Accuracy is 0.927007299270073
Tab. 6. Classificaton report of K-NN
| Precision | Recall | F1-score | Support | |
|---|---|---|---|---|
| Benign | 0.97 | 0.99 | 0.98 | 93 |
| Malignant | 0.98 | 0.93 | 0.95 | 44 |
| Accuracy | 0.97 | 137 | ||
| Macro avg | 0.97 | 0.96 | 0.97 | 137 |
| Weighted avg | 0.97 | 0.97 | 0.97 | 137 |
Accuracy is 0.9708029197080292
The record attributes are necessarily irrelevant or less relevant, which indicates a deviation from the specification. The main idea used in this study is a statistical feature selection technique to eliminate redundant attributes from the data set [12].
After the basic information has been preprocessed, the data set with reduced features and binary classification can use this examination method directly.
In addition, the transfer of the vital classifier with stacking, ensemble and mode enables the modularity of the entire models. During this time, the model still has some flaws. When managing high-dimensional data sets, the confusion matrix, accuracy and specificity and other indicators should be considered.
Clinical data that is less intended for classification will have more missing values, more anomalies and more data than can affect classification performance. These problem factors mentioned above are useful in the proposed model, which is not directly applicable to the clinic. With higher dimensions and more examples, deep learning strategies, the choice of the feature selection method, the decision on the type and number of pattern classifiers can also influence the performance of the service and the time efficiency of the allocation.
Using the random forest technique, Chaurasia et al. achieved 99% accuracy in predicting breast cancer [13]. Ghasemzadeh et al. detect breast cancer with various ML models such as ANN, SVM, C5.0, Chaidtree, Quest tree [14]. With the ANN technique, they obtained mean accuracies of over 0.939, mean sensitivities of up to 0.951 and mean specificities of more than 0.92. The authors extracted the breast mammogram image features employing symmetrical biorthogonal 4.4 wavelet transformations and applied t-test and f-test to the database [15]. The VIES database received an accuracy of 98.0% and 94.2%, respectively, while for the DDSM database, an accuracy of 98.8% and 97.4% was achieved. Li et al. achieved an accuracy of 95% for the initial test set and 88.89%accuracy for the entire test set when classifying breast histology images [16].
The authors reported an accuracy of 91.75 on classifying hematoxylinseosin-stained breast histopathological microscopy images using 400 training images. The authors reported an F-measure of 0.79 to mitigate the class biases issue while classifying mitotic and nonmitotic nuclei in breast cancer histopathology images [17]. Authors use a support vector machine algorithm diagnoses breast cancer with improved accuracy of 97.38%, on the Wisconsin Diagnostic Breast Cancer (WDBC) data set. The authors reported an accuracy of 98% on the classification of breast cancer images using a support vector machine algorithm [18]. Cedeno and co-workers obtained an accuracy of 99.63%, specificity 100% and sensitivity of 99.43% on the classification of breast cancer images. Authors extracted attributes information from the breast cancer dataset using a deep learning approach with F1-scores of 93.53% [19].
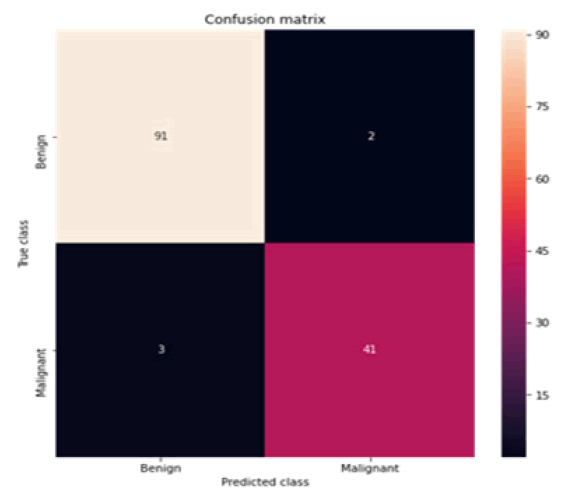
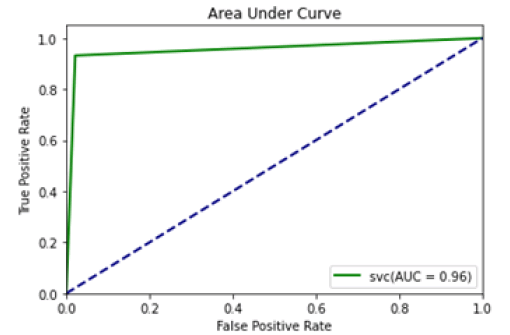
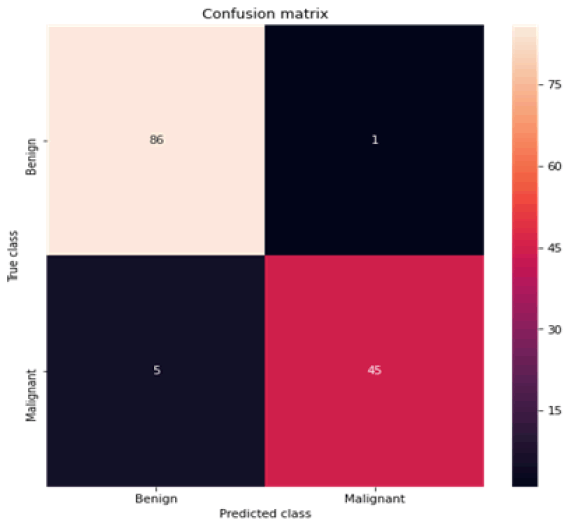
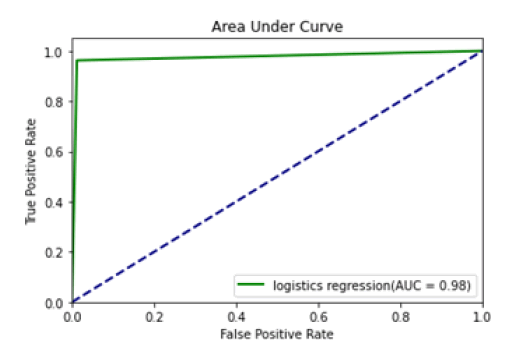
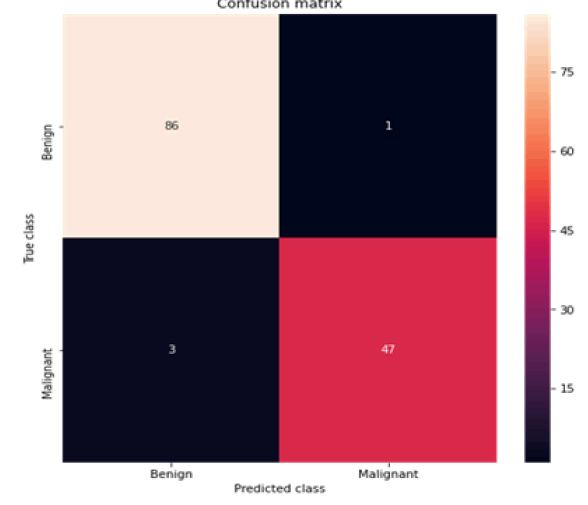
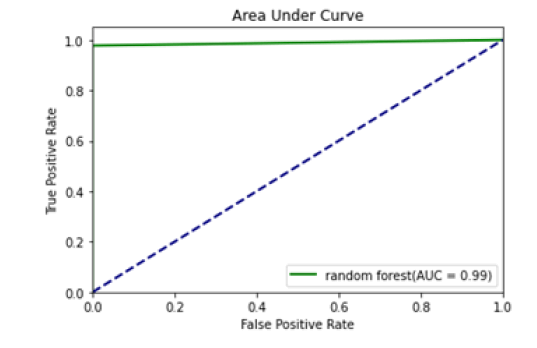
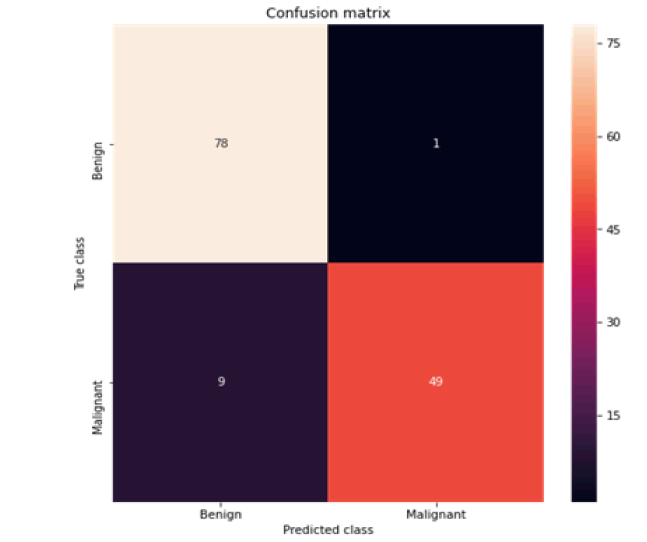
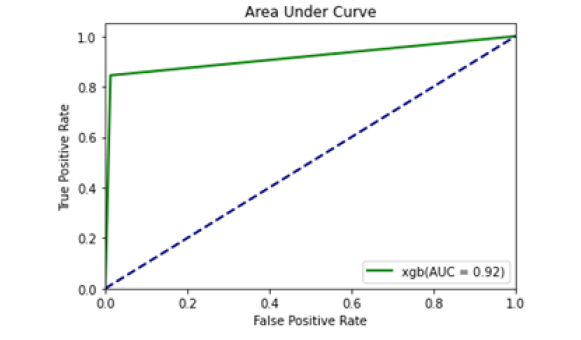
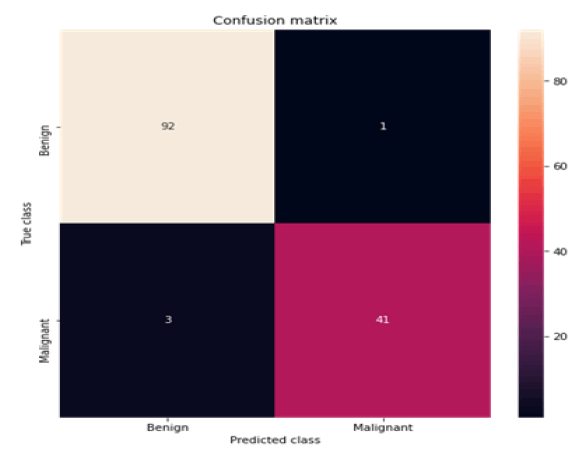
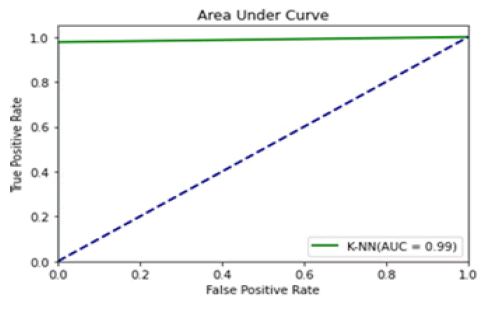
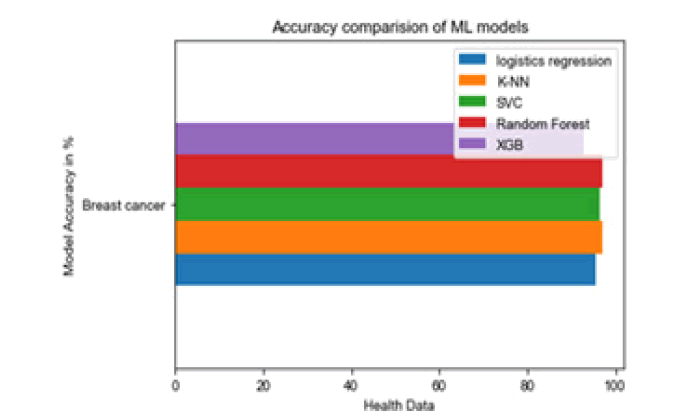
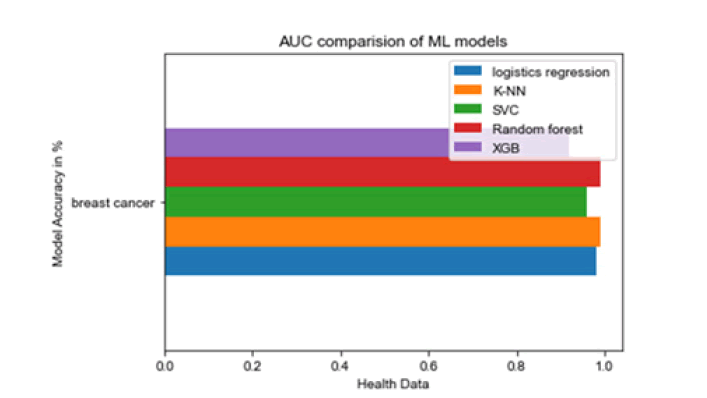
The confusion matrix and area under curve is illustrated individually for all machine learning models depicted subsequent to the respective tables (Figures 3-12).
Figure 3: Confusion matrix SVC
Figure 4: Area under curve SVC
Figure 5: Confusion matrix logistic regression
Figure 6: Area under curve; LRs
Figure 7: Confusion matrix random forests
Figure 8: Area under curve (RFs)
Figure 9:Confusion matrix extreme gradient boosting
Figure 10: Area under curve (XGBs)
Figure 11: Confusion matrix K-NN
Figure 12: Area under curve (K-NNs)
All the techniques have comparatively better F1 score which is nearly 97%. The calculated performance measures are illustrated in Figures 13 and 14. K-NNs outperformed all other machine learning techniques so far we have studied with the highest accuracy of 98.57%, whereas RFs achieved the second-highest accuracy of 97.1%. Random forests and the K-NNs model predict the most significant true positives among the five techniques [20]. In addition, SVC and RFs models predict the most significant number of true negatives and the lowest number of false negatives. The SVC obtains the highest specificity of 96% and the XGB obtains the lowest specificity of 92.3% [21]. All area under curve comparison was done for all machine learning models. In AUC comparison, random forests and K-NNs showed a higher percentage of reliability [22].
Figure 13: Accuracy com-parison of ML models
Figure 14: AUC compari-son of ML models
The research associated with this area is briefly outlined as follows: Sakri et al., work perspective captures the breast cancer problem that Saudi women are facing and it is reported that women over 46 are the main victims of this malignant disease [23]. She focused on improving the accuracy score using Particle Swarm Optimization (PSO) function selector along with Naive Bayes (NB) machine learning algorithms, K-NNs and a reduced debug tree. According to their report, it is one of the main problems in Saudi Arabia.
They reported a comparative analysis between the classification without a feature selection method and the classification with a feature selection method. Following this feeling, the authors implemented five phase-based data analysis techniques for the WBCD data set. The authors used the weka tool for data analysis. With the implementation of PSO, the author has found four functions (for K-NN, NB, RepTree with PSO received 75%, 80% and 81.3%accuracy values) that are best suited for this classification task. The author achieved an accuracy of 70%, 76.3% and 66.3% for NB, RepTree and K-NNs. Another breast cancer dataset obtained from the UCI repository as a result of the proposed work by Kapil and Rana, where they proposed modified decision tree techniques as a weighted decision tree and implemented them on WBCD [24]. For the WBCD dataset, their proposed technique achieved an accuracy of about 99%, while the breast cancer dataset achieved an accuracy of about 85%-90%. Using the chi-square test, they found that they rated each trait and retained the relevant traits for that classification task.
Azar et al. presented a method using variants of the decision tree (Decision Tree Forest (DTF), Single Decision Tree (SDT) and the Boosted Decision Tree (BDT)) to diagnose breast cancer [25]. The decision is made by training the data set and then testing it. The authors showed a method for detecting breast cancer that showed that the accuracy of SDT and BDT in the training phase is 97.07% and 98.83%, respectively, which shows that BDT scores better than SDT. The data set was trained using a tenfold crossvalidation method. The decision tree forest achieved an accuracy of 97.51% in the test phase, while the SDT was 95.75%. The experiments that were performed to detect the disease are discussed here using a Local Linear Wavelet Neural Network (LLWNN) and Recursive Least Squares (RLS). It also provides the lowest Minimum Description Length (MDL) and Squared Classification Error (SCE) values in much less time [26]. To improve the system performance, the LLWNN-RLS delivers the maximum values of the average correct classification rate (CCR) 0.897 and 0.972 for 2 or 3 predictors with a little computing time.
Ferreira et al. presented an efficient method for detecting breast cancer by categorizing the properties of breast cancer data using inductive logic programming [27]. Kappa statistics, F-measure, area under the ROC curve, true positive rate and so on are calculated as a measure of performance. The system simulates on two platforms called Aleph and Weka. A comparative study with a propositional classifier is also carried out. Jhajharia et al. evaluated variants of decision tree algorithms for diagnosing breast cancer [28]. The cart implemented in python achieves the highest accuracy of 97.4% and the highest sensitivity is achieved with the cart implemented in matlab with 98.9% [29]. The system uses the most common decision tree algorithms called cart and C4.5, which are simulated in the Weka platform with matlab and python. The specificity is achieved by cart or C4.5, which are simulated in Weka, to 95.3%. Some of the smart health systems are being developed in the IoT environment to treat such diseases [30].
Conclusion
This study concluded that the random forests and KNN machine leaning models are the most suitable models for breast cancer diagnosis with an accuracy rate of greater than 95%. Additionally, this investigation suggests a feature selection method (mode) that uses an overall base classifier accuracy of 99% compared an ensemble model with batch classifiers to classify the instances with all the attributes compared to a reduced subset of data.
Limitations
This article examined five machine learning mechanisms used to classify breast cancer malignancies. Although the data set is limited, these studies competitive result with other cutting-edge techniques and can provide radiologists with a valuable second opinion for breast cancer diagnosis.
Conflict of Interest
There are no conflicts of interest.
Acknowledgment
We would like to thank the management of the institute for sup-porting every possible side to make this article. Authors acknowl-edge STC to provide support in write-up and review
References
- Fletcher-Brown J, Pereira V, Nyadzayo MW. Health marketing in an emerging market: The critical role of signaling theory in breast cancer awareness. J Bus Res. 2018;86:416-34.
- Mathur P, Sathishkumar K, Chaturvedi M, Das P, Sudarshan KL, et al. Cancer statistics, 2020: Report from national cancer registry programme, India. JCO Glob Oncol. 2020;6:1063-75.
[Crossref] [Google Scholar] [PubMed]
- Mori M, Akashi-Tanaka S, Suzuki S, Daniels MI, Watanabe C, et al. Diagnostic accuracy of contrast-enhanced spectral mammography in comparison to conventional full-field digital mammography in a population of women with dense breasts. Breast Cancer. 2017;24:104-10.
[Crossref][Google Scholar] [PubMed]
- Kurihara H, Shimizu C, Miyakita Y, Yoshida M, Hamada A, et al. Molecular imaging using PET for breast cancer. Breast Cancer. 2016;23:24-32.
[Crossref] [Google Scholar] [PubMed]
- Azar AT, El-Said SA. Probabilistic neural network for breast cancer classification. Neural Comp Appl. 2013;23:1737-51.
- Nagashima T, Suzuki M, Yagata H, Hashimoto H, Shishikura T, et al. Dynamic-enhanced MRI predicts metastatic potential of invasive ductal breast cancer. Breast Cancer. 2002;9:226-30.
[Crossref] [Google Scholar] [PubMed]
- Ayon SI, Islam MM, Hossain MR. Coronary artery heart disease prediction: A comparative study of computational intelligence techniques. IETE J Res. 2022;68:2488-507.
- Muhammad LJ, Islam MM, Usman SS, Ayon SI. Predictive data mining models for novel coronavirus (COVID-19) infected patients’ recovery. SN Comp Sci. 2020;1:206.
[Crossref] [Google Scholar] [PubMed]
- Islam MM, Iqbal H, Haque MR, Hasan MK. Prediction of breast cancer using support vector machine and K-nearest neighbors: In2017 IEEE Region 10 Humanitarian Technology Conference (R10-HTC) 2017, pp. 226-29.
- Haque MR, Islam MM, Iqbal H, Reza MS, Hasan MK. Performance evaluation of random forests and artificial neural networks for the classification of liver disorder. In2018 international conference on computer, communication, chemical, material and electronic engineering (IC4ME2) 2018, pp. 8:1-5.
- Ben-Hur A, Horn D, Siegelmann HT, Vapnik V. Support vector clustering. J Mach Learn Res. 2001;2:125-37.
- Zhang Z. Introduction to machine learning: K-nearest neighbors. Ann Transl Med. 2016;4:218.
[Crossref] [Google Scholar] [PubMed]
- Chaurasia V, Pal S. Applications of machine learning techniques to predict diagnostic breast cancer. SN Comp Sci. 2020;1:270.
- Ghasemzadeh A, Sarbazi Azad S, Esmaeili E. Breast cancer detection based on Gabor-wavelet transform and machine learning methods. Int J Mach Learn Cybern. 2019;10:1603-12.
- Beura S, Majhi B, Dash R. Mammogram classification using two dimensional discrete wavelet transform and gray-level co-occurrence matrix for detection of breast cancer. Neurocomp. 2015;154:1-4.
- Li Y, Wu J, Wu Q. Classification of breast cancer histology images using multi-size and discriminative patches based on deep learning. IEEE Access. 2019;7:21400-08.
- Yang Z, Ran L, Zhang S, Xia Y, Zhang Y. EMS-net: Ensemble of multiscale convolutional neural networks for classification of breast cancer histology images. Neurocomp. 2019;366:46-53.
- Wahab N, Khan A, Lee YS. Two-phase deep convolutional neural network for reducing class skewness in histopathological images based breast cancer detection. Comp Biol Med. 2017;85:86-97.
[Crossref] [Google Scholar] [PubMed]
- Zheng B, Yoon SW, Lam SS. Breast cancer diagnosis based on feature extraction using a hybrid of K-means and support vector machine algorithms. Exp Sys Appl. 2014;41:1476-82.
- Hassanien AE, Kim TH. Breast cancer MRI diagnosis approach using support vector machine and pulse coupled neural networks. J Appl Log. 2012;10:277-84.
- Marcano-Cedeño A, Quintanilla-Domínguez J, Andina D. Breast cancer classification applying artificial metaplasticity algorithm. Neurocomp. 2011;74:1243-50.
- Zhang X, Zhang Y, Zhang Q, Ren Y, Qiu T, et al. Extracting comprehensive clinical information for breast cancer using deep learning methods. Int J Med Inform. 2019;132:103985.
[Crossref] [Google scholar] [PubMed]
- Sakri SB, Rashid NB, Zain ZM. Particle swarm optimization feature selection for breast cancer recurrence prediction. IEEE Access. 2018;6:29637-47.
- Juneja K, Rana C. An improved weighted decision tree approach for breast cancer prediction. Int J Inf Technol. 2020;12:797-804.
- Azar AT, El-Metwally SM. Decision tree classifiers for automated medical diagnosis. Neu Comp Appl. 2013;23:2387-403.
- Senapati MR, Mohanty AK, Dash S, Dash PK. Local linear wavelet neural network for breast cancer recognition. Neu Comp Appl. 2013;22:125-31.
- Ferreira P, Dutra I, Salvini R, Burnside E. Interpretable models to predict breast cancer. In2016 IEEE International Conference on Bioinformatics and Biomedicine (BIBM) 2016, pp. 1507-11.
- Jhajharia S, Verma S, Kumar R. A cross-platform evaluation of various decision tree algorithms for prognostic analysis of breast cancer data. In2016 International Conference on Inventive Computation Technologies (ICICT) 2016;3:1-7.
- Islam MM, Rahaman A, Islam MR. Development of smart healthcare monitoring system in IoT environment. SN Comp Sci. 2020;1:1-1.
[Crossref] [Google Scholar] [PubMed]
- Rahaman A, Islam MM, Islam MR, Sadi MS, Nooruddin S. Developing IoT based smart health monitoring systems: A review. Intellig Artif. 2019;33:435-40.
