Research Article - Onkologia i Radioterapia ( 2023) Volume 17, Issue 9
MicroRNA-223 and oxidant-antioxidant status in leukemia patients
Zainab M. Hillel and Zainab N. Al-Abady*Zainab N. Al-Abady, Department of Chemistry, College of Sciences, University of Al-Qadisiyah, Diwaniyah, Iraq,
Received: 14-Jul-2023, Manuscript No. OAR-23-110311; Accepted: 10-Sep-2023, Pre QC No. OAR-23-110311 (PQ); Editor assigned: 17-Jul-2023, Pre QC No. OAR-23-110311 (PQ); Reviewed: 24-Jul-2023, QC No. OAR-23-110311 (Q); Revised: 04-Sep-2023, Manuscript No. OAR-23-110311 (R); Published: 15-Sep-2023
Abstract
The aim of the study was to elucidate miRNA-223 expression in patients with acute myeloid leukemia, acute lymphocytic leukemia and chronic myeloid leukemia and regulate miRNA-223 expression in oxidative stress based on current research. 40 patients with Acute Lymphoblastic Leukemia (ALL), 40 patients with acute myeloid leukemia (AML), 30 patients with Chronic Myeloid Leukemia (CML) and 40 healthy subjects served as controls. A colorimetric method was used to measure Catalase (CAT) and Malondialdehyde (MDA) activity. The serum concentrations of Heme Oxygenase 1 (HMOX1) were measured by Enzyme Immunoassay (ELISA). A quantitative polymerase chain reaction was used to determine serum miRNA-223 expression. It was found that CAT activity was significantly reduced in the patient groups compared to the control group (p<0.05), but MDA and HMOX1 concentrations were significantly higher in the patient groups compared to the control group (p<0, 05). 0.05).When patient groups were compared to control groups, miRNA-223 expression increased in patients (p<0.05). It has been reported that miRNA-223 expression is associated with the development of leukemia diseases such as ALL, AML and CML. In people with leukemia, especially AML. The oxidative stress biomarker is significantly affected by increased miRNA_223 expression.
Keywords
leukemia, oxidant-antioxidant, mirna-233
Introduction
Leukemia is a form of blood tissue cancer. The delicate inside of the body is called bone marrow. Hematopoietic stem cells are composed of bone marrow. It develops into a variety of blood cells, each with a different function, including platelets, red blood cells, and White Blood Cells (WBCs) [1]. When the ratio of pro-oxidants to antioxidants is out of balance, oxidative stress results, which promotes the growth of leukemia [2]. In order to start lipid peroxidation, Reactive Oxygen Species (ROS) such hydroxyl radicals, hydrogen peroxide, and superoxide anions can remove a hydrogen atom from polyunsaturated fatty acids in membrane lipids. When these free radicals come into touch with macromolecules like proteins, lipids, and nucleic acids in the membrane, they can cause severe tissue damage [3]. Previous research has shown that leukemia patients had reduced antioxidant defenses and increased lipid peroxidation [4].
The peroxisome-resident antioxidant enzyme CAT supports the cell's defense against free radicals [5]. Because CAT acts to prevent the buildup of harmful levels of oxidants, it can shield cells from the development and spread of cancer. As a result, more research has found that CAT expression is downregulated in a number of malignancies [6]. However, other cancer cells have high levels of CAT expression, which is crucial for tumor growth and spread, to make up for the high levels of ROS generation and block ROSmediated cell death processes [7].
Malondialdehyde (MDA) from the peroxidation of polyunsaturated fatty acids is a good biomarker of free radical damage and oxidative stress in biological samples [8]. MDA levels can indicate oxidative stress and disease development in solid tumors, gastric cancer, breast cancer and leukemia. Mutagenic and genotoxic MDAs can accelerate the development of cancer [9]. Biliverdin reductase converts bilirubin to heme, free iron, and CO. The only inducible heme oxygenase is HO-1 [10]. Depletion of HO-1 alters cellular homeostasis in genetically engineered mice and humans [11]. Hemolytic anemia, low bilirubin, high ferritin, liver and kidney iron accumulation, visible endothelial damage with activation of the coagulation cascade, HO-1 knockout and HO-1-deficient mice promote inflammation and oxidative stress [12]. Because of its anti-apoptotic effects, HO-1 could be a target for cancer therapy [13]. These 19-25-nucleotide noncoding single-stranded RNAs regulate transcriptional and posttranscriptional gene expression via unique interactions with target genes [14]. MiRNAs affect metabolism, hunger, adipocyte differentiation, and oxidative stress [15]. Redox sensors and other ROS modulators, such as essential components of cellular antioxidant machinery, are regulated by miRNA, but Reactive Oxygen Species (ROS) can induce or suppress miRNA expression and regulate target genes [16]. MiR-223 is connected to the development of several cancers, the immune system, and hematopoiesis [17]. The purpose of this work was to outline the regulation of miRNA-223- driven molecular gene expression, its connection to oxidative stress and leukemia development, and to review recent developments in this area.
Materials and Methods
The study involved 150 people who were divided into four groups: people with acute lymphoblastic leukemia, people with acute myeloid leukemia, people with chronic myeloid leukemia, and healthy people. All patient information such as gender, age and disease duration was documented and the control group was carefully screened to ensure they did not have any other disease or disorder. The average age of the population ranged from 17 to 70 years (October 2022-February 2023). The laboratory tests were conducted at the Nabu Science Foundation (Baghdad, Iraq), the Al Kindi Laboratory, the Biochemistry Laboratory and the Advanced Research Laboratory of the College of Sciences (Al-Qadisiyah University).
Five milliliter blood samples were taken from all study groups. The blood, after 15 minutes of coagulation, was centrifuged at (4000 rpm) for 15 minutes. The separated serum was aliquoted and placed into 300 µl Eppendorf tubes, one of which was stored at (-40° C) for miRNA analysis and the other at (-20°C) for biochemical analysis. (CAT) was determined by UV spectrometry [18]. MDA concentrations were determined spectrophotometrically [19]. HMOX1 levels were measured using the sandwich ELISA method (Human Hemoxygenase 1 (HMOX1) ELISA Kit, BT-lab China). The serum expression of miRNA-223 was assessed by qPCR and 0.3 ml of serum was used for RNA extraction (TRIzol™ Reagent, Invitrogen, USA). The cDNA was generated using miRNA with miR-223 RT primer (ProtoScript® First Strand cDNA Synthesis Kit, NEB, UK). Luna Universal qPCR MasterMix (NEB, UK) was used for the PCR.The resulting cDNA was annealed with universal forward and reverse primers specific for miRNA-223 (TABLE 1).
Table. 1. qPCR primers are used in experiments.
| Primers | Sequence | Size | GC% | Product Size (bp) |
|---|---|---|---|---|
| miRNA-223_RT | GTCGTATCCAGTGCGTGTCGTGGAGTCGGCAATTGCACTGGATACGACGGGGTA | 54 | 57 | ___ |
| miRNA-223For miRNA-223Rev | TGTCAGTTTGTCAAA CAGTGCGTGTCGTGGAGT | 15 18 | 33 61 | 72 |
| U6 For U6 Rev | CTCGCTTCGGCAGCACA AACGCTTCACGAATTTGCGT | 17 20 | 40 40 | 94 |
Statistical analysis
The d ata w as a ssembled, e xamined, a nd s hown u sing G raphPad Prism 9.2.0. . Numbers are expressed as mean and SEM. For regularly distributed variables, a one-way ANOVA test was used to compare the means of different groups. If the p-value was less than 0.05, it was considered significant.
Results
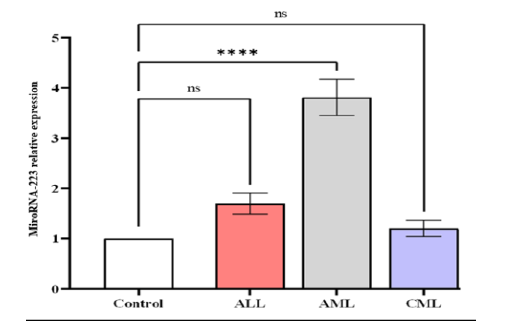
qPCR miRNA analysis showed serum levels of miRNA-223 expression increased significantly in in patients with AML (3.817 ± 0.3623) compared to ALL (1.695 ± 0.2092), CML (1.203 ± 0.156), and control (1 ± 0) (Figure 1). Our research revealed a higher significant difference (p-value<0.0001) in the expression between patients compared to the control, also showed significant difference in mean values between ALL with AML, and AML with CML (Figures 1 and 2).
Figure 1: The level of expression of microRNA-223 in in different studied groups, control ALL, AML, and CML. Data are expressed as means ± SEM, * A statistically signi icant difference between the patients and the control is indicated (P<0.05)
Figure 2: Estimation Relative miRNA-223 gene expression. A comparison of those who are healthy and those who have leukemia (LKA). a comparison of the control group and the patients, (B) miRNA-223 levels significantly decreased in the patient group compared to the control group, according to an estimation plot, the difference was significantly different (p-value <0.0001). Means and SEM are used to present the data
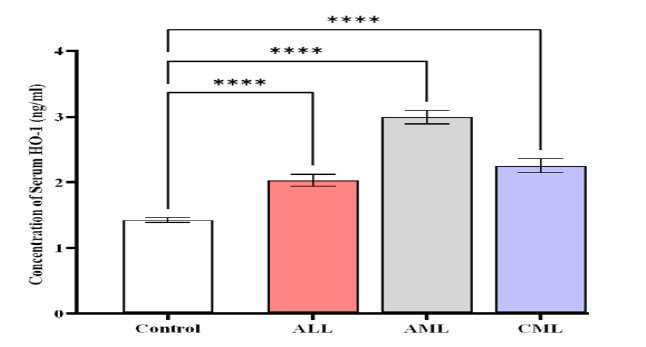
The HMOX1 levels were higher in patients with AML (2.992 ± 0.1094) compared to CML (2.259 ± 0.1441) ng/mL,
ALL (2.027 ± 0.09588) ng/mL, and control (1.423 ± 0.0412) ng/ mL (Figure 3).
Figure 3: Comparison of HMOX1 level in different studied groups, control ALL, AML, and CML. Data are expressed as means ± SEM, *Indicates statistically significant differences between patients as compared to the control group (P < 0.05)
The results indicated a significant difference (p-value<0.0001) in the levels of HMOX1 between patients compared to the control, also showed significant difference in mean values between ALL with AML, and AML with CML (Figure 4).
Figure 4: Estimation concentrations of heme 0xygenase 1 [HO-1 (ng/mL)] A comparison between control and patients with Leukemia (LKA). (A) a comparison of the control and patients, (B) an estimation plot that shows there was a significant rise in HO-1 levels in the patient group compared to the control group, the significant difference (p-value <0.0001). Means and SEM are used to express data. indicates *significant differences compared to the non-pregnant, P≤0.05
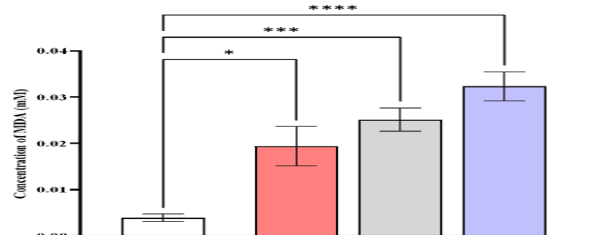
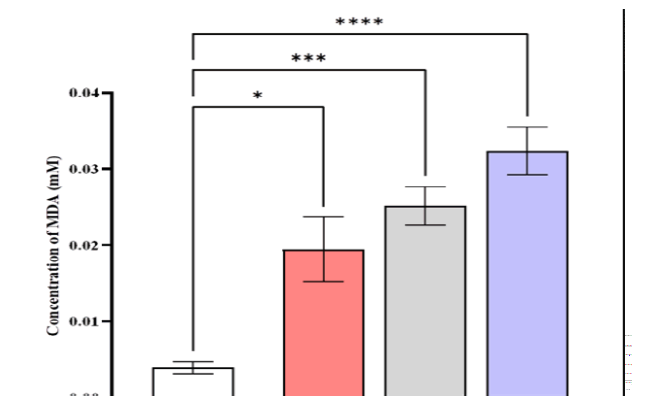
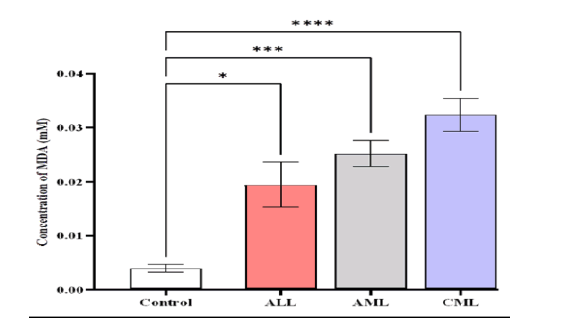
The serum MDA levels were higher in patients with CML (0.0323 ± 0.00315) mmole/L compared to AML (0.0252 ± 0.0025), ALL (0.0194 ± 0.00426), and control (0.0039 ± 0.000795) mmole/L (Figure 5).
Figure 5: Comparison of MDA level in different studied groups, control ALL, AML, and CML. Data are expressed as means ± SEM, * Indicates statistically significant differences between patient group as compared to the control group (P < 0.05)
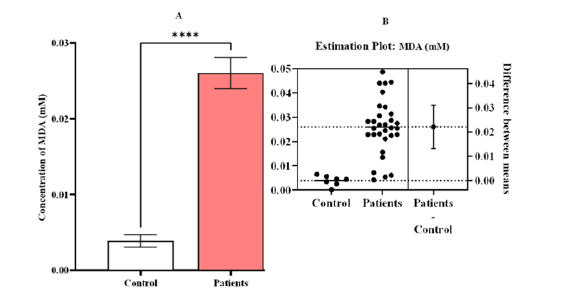
The results exhibited a significant difference (p-value<0.0001) in the levels of MDA between patients compared to the control, also showed significant difference in mean va lues be tween AL L and CML, while showed non-significant difference between ALL with AML, and AML with CML. (Figure 6)
Figure 6: Estimation concentrations of malondialdehyde [MDA (mM)] A comparison between patients and control with Leukemia (LKA). (A) a contrast between the patients and the control group, (B) an estimation plot that shows that the concentration of MDA was significantly greater in the sick group than in the control group, the significant difference (p-value <0.0001). Means and SEM are used to express data. indicates *significant differences compared to the non-pregnant, P ≤ 0.05
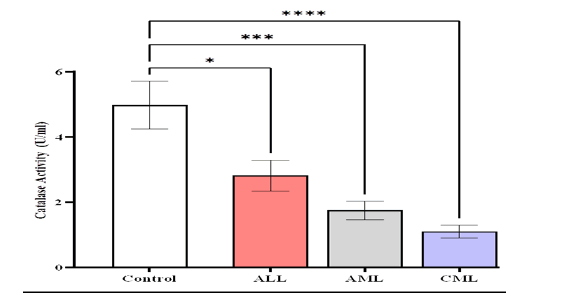
The findings of this study showed lower serum catalase activity (CAT) levels (1.103 ± 0.203) U/ml in patients with (CML) compared to AML (1.749 ± 0.286) U/ml, ALL (2.82 ± 0.473) U/ml and control (4.978 ± 0.731) U/ml (Figure 7).
Figure 7: Comparison of CAT activity levels in different studied groups, control ALL, AML, and CML. Means and SEM are used to express data, *Indicates statistically significant differences between patient group as compared to the control group (P<0.05)
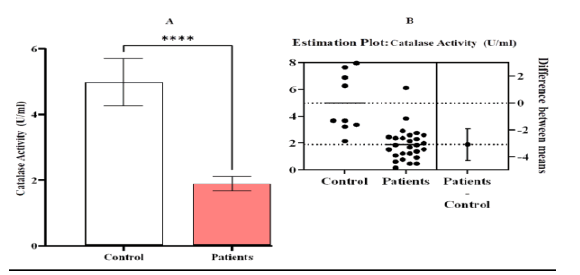
Our research discovered a significant difference (p-value< 0.0001) in the activity of CAT between patients compared to the control, while showed non-significant difference between the patients groups compared to them (Figure 8).(TABLE 2)
Tab. 2. Biochemical parameters value for all studied groups.
| Characteristic | Control | ALL | AML | CML | P-value |
|---|---|---|---|---|---|
| n= 40 | n= 40 | n= 40 | n= 30 | ||
| Concentration of Serum HO-1 (ng/ml) | |||||
| Range | 1.121- 1.682 | 1.356 - 2.849 | 2.184 - 3.998 | 1.756 - 2.958 | <0.0001 |
| Mean ± SEM | 1.423 ± 0.0412 | 2.027 ± 0.09588 | 2.992 ± 0.1094 | 2.259 ± 0.1441 | |
| Gene expression of miRNA-223 | |||||
| Range | 01-Jan | 1.117 - 2.732 | 2.214 - 4.857 | 0.4623 - 1.768 | <0.0001 |
| Mean ± SEM | 1 ± 0 | 1.695 ± 0.2092 | 3.817 ± 0.3623 | 1.203 ± 0.156 | |
| Concentration of Serum MDA (mmole/L) | |||||
| Range | 0.000135 - 0.00646 | 0.00539 - 0.0444 | 0.00417 - 0.0346 | 0.0156 - 0.0487 | <0.0001 |
| Mean ± SEM | 0.0039 ± 0.000795 | 0.0194 ± 0.00426 | 0.0252 ± 0.0025 | 0.0323 ± 0.00315 | |
| Catalase Activity (U/ml) | |||||
| Range | 2.141 - 7.951 | 1.376 - 6.116 | 0.4587 - 2.905 | 0.1529 - 1.988 | <0.0001 |
| Mean ± SEM | 4.978 ± 0.731 | 2.82 ± 0.473 | 1.749 ± 0.286 | 1.103 ± 0.203 | |
Figure 8: Estimation activity of catalase [CAT (U/ml)] A comparison between patients and control with Leukemia (LKA). (A) a contrast between the patients and the control group, (B) an estimation plot demonstrating a significant decline in the activity of CAT in the patient group compared to the control, the significant difference ( p-value <0.0001). Means and SEM are used to express data. indicates *significant differences compared to the non-pregnant, p ≤ 0.05
Discussion
The mitochondrial respiratory chain is continually producing Reactive Oxygen Radicals (ROS) with a high oxidation potential, such as singlet oxygen (1O2), Hydrogen Peroxide (H2O2 ), superoxide anion (O-2) and hydroxyl free radical (•OH). ROS may damage proteins, lipids, and nuclear acids, resulting in oxidative damage. ROS are continually generated and removed by antioxidant defense systems throughout normal physiological activities [20]. Under pathological circumstances, excessive ROS generation promotes lipid peroxidation and oxidative damage. An imbalance in the defense systems against ROS and antioxidants leads in oxidative alteration of the cellular membrane or intracellular components [21].
It has been discovered that catalase activity is diminished in a variety of malignant tumor cells [22, 23]. In our investigation, it was discovered that the group with CML, AML, and ALL had significantly lower CAT activity. These results may confirm the existence of a chronic oxidative stress in acute leukemia by showing a potential connection between elevated free radical levels and lower antioxidant levels [22]. Under normal circumstances, the first line of defense against oxidative damage is CAT, which scavenges free radicals. CAT first breaks down superoxide and H2O2 before combining them to form the more harmful hydroxyl radical. Cross-linking or enzyme depletion brought on by increased lipid peroxidation may be the cause of the decrease in CAT activity [24].
One of three Heme Oxygenase (HO)-1 isoenzymes that catalyze the breakdown of heme into free iron, Carbon Monoxide (CO), and biliverdin, all of which have potent antioxidant and antiinflammatory effects [25]. Because of this, HO-1 exhibits protective effects in a variety of human diseases, such as cancer, metabolic diseases, iron metabolism abnormalities, neurodegenerative diseases, cardiovascular diseases, and different inflammatory diseases [26]. In the current investigation, patients with AML, CML, and ALL had considerably higher serum levels of (HO)-1 than the control group. It has been demonstrated that HO-1 is becoming an intriguing new target in CML cells, playing a significant role in inhibiting apoptotic processes [27]. Increased ROS caused oxidative DNA damage in AML, ALL, and CML chronic phase, which led to genomic instability and the potential for imatinib-resistant and further chromosomal abnormalities [28]. The overexpression of antioxidant proteins like HO-1 counteracts the increased ROS levels, which explains why patients have high amounts of this protein. Evidence from Hermann et al. suggests that H0-1 might be a new target for AML treatment [28].
Patients with leukemia may suffer from oxidative stress due to a higher proportion of mature and immature myeloid series cells, as well as other unknown causes. As a substitute marker for oxidative tissue damage, Malondialdehyde (MDA), a stable end product of free radical-induced lipid peroxidation, has been utilized [29]. In the current investigation, patients with AML, ALL, and CML had considerably highly levels of lipid peroxidation in their serum levels of MDA than did healthy individuals. This can be a result of cellular antioxidants producing more free radicals or clearing them away insufficiently. The current findings are consistent with prior research on hematological malignancies, including different types of cancer in humans [30, 31].
When compared to the control group, the miRNA-223 gene expression levels in the AML group were significantly higher, where the results agree with both Daschkey, Röttgers et al., and Gentner, Pochert et al., [32, 33], while little increase was observed in the ALL, and CML groups compared with the control. It is strongly recommended that a novel drug target or therapeutic approach be developed for the treatment of human cancer by the distinct roles of miR-223 in the start tumor development, growth, and metastasis. A single miR-223 can also target a wide range of genes, such as Mef2c, FBXW7, and EPB41L3, which can then take part in a number of oncogenic pathways. Therefore, changing the quantity of miR-223 may have an effect on numerous pathways at once. Profiling technology will enable customized miR-223-based therapy [34].
MiRNA-223 (miR-223) has pleiotropic effects in several cancer types, according to growing studies. In certain cancer types, such as T-Cell Acute Lymphoblastic Leukemia (T-ALL) and Acute Myeloid Leukemia (AML) [35, 36]. MiR-223 performs an oncomiR role. As a tumor suppressor, it works. MiR-223 in particular has a big effect on the immune system, and we now know more about how it affects T-ALL and AML. The precise mechanism through which miR-223 influences the development of cancer is yet unknown. Increased levels of miR-223 do not always support oncogenesis because glucocorticoids, which enhance apoptosis in T-ALL and miR-223 expression in glucocorticoid-sensitive cell lines do not necessarily promote oncogenesis [37]. It has also been shown that miR-223 affects the cell cycle in AML and targets the transcription factor E2F1. As part of the regulating process, E2F1 may raise the expression of C/EBPa, which subsequently increases the expression of miR-223 [38]. Uncertainty surrounds miRNA-223's effect on Chronic Myeloid Leukemia (CML). However, it is well known that the BCR-ABL oncoproteins, the leukemia-specific gene products of the Philadelphia chromosomal translocation, repress C/EBP, a critical regulator of granulocytic development and a wellknown transcriptional regulator of miRNA-223 [39].
Chronic granulocytic maturation arrest, which may be connected to miR-223, is found in CML., as well as other transcription factors that are implicated in miR-223 expression being dysregulated. MEF2C is a transcription factor essential for cell survival and growth that moreover contributes to lymphopoiesis and myelopoiesis [40]. A miR-223 target in CML, according to reports. Additionally, miR-223 targets PTBP2, a neuronalspecific RNA-binding protein involved in nuclear transcript splicing and the equilibrium of specific miRNA in the cytoplasm, in CML [41].
Conclusion
Increased expression of miRNA-223 has an impact on leukemia development, particularly AML. Interference with the oxidant/ antioxidant balance. Together, these discoveries may result in a deeper comprehension of the immune response, cell proliferation, and cancer cell activities in both health and illness, particularly in leukemia..
Author´s Contributions
Zainab Mohammed Hillel and Dr. Zainab Nejim Al-Abady were involved in the design of the study, analysis of the results, and report writing. The authors confirmed the final version before it was submitted.
References
- Kumar S, Mishra S, Asthana P, Automated detection of acute leukemia using k-mean clustering algorithm. In: Advances in Computer and Computational Sciences: Proc. ICCCCS .2016,2; 2018. Springer. Google Scholar Crossref
- Lu J, Wang Z, Cao J, Chen Y, Dong Y. A novel and compact review on the role of oxidative stress in female reproduction. Reprod. Biol. Endocrinol. 2018;16:1-18. Google Scholar Crossref
- Bhattacharjee S, Bhattacharjee S. ROS and oxidative stress: origin and implication. In: React. oxyg. species plant biol. 2019:1-31. Google Scholar Crossref
- Haß C, Belz K, Schoeneberger H, Fulda S. Sensitization of acute lymphoblastic leukemia cells for LCL161-induced cell death by targeting redox homeostasis. Biochem. pharmacol. 2016;105:14-22. Google Scholar Crossref
- Kapoor D, Singh S, Kumar V, Romero R, Prasad R,et al,. Antioxidant enzymes regulation in plants in reference to reactive oxygen species (ROS) and reactive nitrogen species (RNS). Plant Gene. 2019;19:100182. Google Scholar Crossref
- Baker AM, Oberley LW, Cohen MB. Expression of antioxidant enzymes in human prostatic adenocarcinoma. The Prostate. 1997;32:229-33. Google Scholar Crossref
- Galasso M, Dalla Pozza E, Chignola R, Gambino S, Cavallini C, et al. The rs1001179 SNP and CpG methylation regulate catalase expression in chronic lymphocytic leukemia. Cell. Mol. Life Sci. 2022;79:521. Google Scholar Crossref
- Del Rio D, Stewart AJ, Pellegrini N. A review of recent studies on malondialdehyde as a toxic molecule and biological marker of oxidative stress. Nutrition, metabolism and cardiovascular diseases. 2005;15:316-28. Google Scholar Crossref
- Feron V, Til H, De Vrijer F, Woutersen R, Cassee F, et al,. Aldehydes: occurrence, carcinogenic potential, mechanism of action and risk assessment. Mutation Research/Genetic Toxicology. 1991;259:363-85. Google Scholar Crossref
- Liu B, Qian J-M. Cytoprotective role of heme oxygenase-1 in liver ischemia reperfusion injury. Int. j. clin. exp. med. 2015;8:19867. Google Scholar Crossref
- Dinkovaâ?Kostova AT, Kostov RV, Kazantsev AG. The role of Nrf2 signaling in counteracting neurodegenerative diseases. FEBS j.,2018;285:3576-90. Google Scholar Crossref
- Kawashima A, Oda Y, Yachie A, Koizumi S, Nakanishi I. Heme oxygenase–1 deficiency: The first autopsy case. Human pathology. 2002;33:125-30. Google Scholar Crossref
- Loboda A, Jozkowicz A, Dulak J. HO-1/CO system in tumor growth, angiogenesis and metabolism—Targeting HO-1 as an anti-tumor therapy, Vasc. pharmacol. 2015;74:11-22. Google Scholar Crossref
- Pu M, Chen J, Tao Z, Miao L, Qi X, et al. Regulatory network of miRNA on its target: coordination between transcriptional and post-transcriptional regulation of gene expression. Cell. Mol. Life Sci. 2019;76:441-51. Google Scholar Crossref
- Krützfeldt J, Stoffel M. MicroRNAs: a new class of regulatory genes affecting metabolism. Cell metabolism. 2006;4:9-12. Google Scholar Crossref
- Fioravanti A, Pirtoli L, Giordano A, Dotta F. Crosstalk between MicroRNA and Oxidative Stress in Physiology and Pathology. MDPI; 2020:1270. Google Scholar Crossref
- Yuan S, Wu Q, Wang Z, Che Y, Zheng S, et al. miR-223: An immune regulator in infectious disorders. Front. immunol. 2021;12:781815. Google Scholar Crossref
- Aebi H. Catalase. Methods enzym. anal.: Elsevier; 1974. 673-84. Google Scholar Crossref
- Guidet B, Shah SV. Enhanced in vivo H2O2 generation by rat kidney in glycerol-induced renal failure. Am. J. Physiol.-Ren. Physiol.. 1989;257:440-F5. Google Scholar Crossref
- Kanter M, Demir H, Karakaya C, Ozbek H. Gastroprotective activity of Nigella sativa L oil and its constituent, thymoquinone against acute alcohol-induced gastric mucosal injury in rats. World J. Gastroenterol.: WJG.2005;11:6662. Google Scholar Crossref
- Tunçel Ne, ERKASAP NI, Å?AHË? INTÜRK V, AK DID, Tuncel M. The protective effect of vasoactive intestinal peptide (VIP) on stressâ?induced gastric ulceration in rats. Ann. N. Y. Acad. Sci.,1998;865:309-22. Google Scholar Crossref
- Demir C, Demir H, Esen R, Atmaca M, Tagdemir E. Erythrocyte catalase and carbonic anhydrase activities in acute leukemias. Asian Pac J Cancer Prev. 2010;11:247-50. Google Scholar Crossref
- Ammar M, Ben Mahmoud L, Medhaffar M, Ghozzi H, Sahnoun Z, et al. Relationship of oxidative stress in the resistance to imatinib in Tunisian patients with chronic myeloid leukemia: A retrospective study. J. Clin. Lab. Anal.,2020;34:23050. Google Scholar Crossref
- Salo DC, Pacifici RE, Lin SW, Giulivi C, Davies K. Superoxide dismutase undergoes proteolysis and fragmentation following oxidative modification and inactivation. J. Biol. Chem.,1990;265:11919-27. Google Scholar Crossref
- Yachie A. Heme oxygenase-1 deficiency and oxidative stress: A review of 9 independent human cases and animal models. Int. J. Mol. Sci.,2021;22:1514. Google Scholar Crossref
- Dunn LL, Midwinter RG, Ni J, Hamid HA, Parish CR,et al., New insights into intracellular locations and functions of heme oxygenase-1. Antioxid. redox signal.,2014;20:1723-42. Google Scholar Crossref
- Salerno L, Romeo G, Modica MN, Amata E, Sorrenti V, et al. Heme oxygenase-1: A new druggable target in the management of chronic and acute myeloid leukemia. Eur. j. med. chem.,wfgtdcd2017;142:163-78. Google Scholar Crossref
- Herrmann H, Kneidinger M, Cerny-Reiterer S, Rulicke T, Willmann M, et al. The Hsp32 inhibitors SMA-ZnPP and PEG-ZnPP exert major growth-inhibitory effects on D34+/CD38+ and CD34+/CD38-AML progenitor cells. Curr. cancer drug targets,2012;12:51-63. Google Scholar Crossref
- Colombo D-DIRR. R Giustarini D Milzani A: Biomarkers of oxidative damage in human disease. Clin Chem. 2006;52:601-23. Google Scholar Crossref
- Singh V, Ghalaut P, Kharb S, Singh G. Plasma concentrations of lipid peroxidation products in children with acute leukaemia. Indian J. Med. Sci.,2001;55:215-7. Google Scholar Crossref
- Rajeshwari U, Shobha I, Raghunatha R, Andallu B. Oxidative stress and antioxidant status in acute and chronic myeloid Leukemia patients. Open J. Blood Dis.. 2013;2013. Google Scholar Crossref
- Daschkey S, Röttgers S, Giri A, Bradtke J, Teigler-Schlegel A, et al. MicroRNAs distinguish cytogenetic subgroups in pediatric AML and contribute to complex regulatory networks in AML-relevant pathways. PloS one. 2013;8:56334. Google Scholar Crossref
- Gentner B, Pochert N, Rouhi A, Boccalatte F, Plati T, Berg T, et al. MicroRNA-223 dose levels fine tune proliferation and differentiation in human cord blood progenitors and acute myeloid leukemia. Experimental hematology. 2015;43:858-68. e7Google Scholar Crossref
- Gao Y, Lin L, Li T, Yang J, Wei Y. The role of miRNA-223 in cancer: function, diagnosis, and therapy. Gene. 2017;616:1-7. Google Scholar Crossref
- Mavrakis KJ, Van Der Meulen J, Wolfe AL, Liu X, Mets E, Taghon T, et al. A cooperative microRNA-tumor suppressor gene network in acute T-cell lymphoblastic leukemia (T-ALL). Nature genetics. 2011;43:673-8. Google Scholar Crossref
- Fazi F, Racanicchi S, Zardo G, Starnes LM, Mancini M, et al. Epigenetic silencing of the myelopoiesis regulator microRNA-223 by the AML1/ETO oncoprotein. Cancer cell. 2007;12:457-66. Google Scholar Crossref
- Haneklaus M, Gerlic M, O'Neill LA, Masters S. miRâ?223: infection, inflammation, and cancer. J. intern. med.. 2013;274:215-26. Google Scholar Crossref
- Yuan X, Berg N, Lee JW, Le T-T, Neudecker Vet al. MicroRNA miR-223 as regulator of innate immunity. J. leukoc. biol.,2018;104:515-24. Google Scholar Crossref
- Perrotti D, Cesi V, Trotta R, Guerzoni C, Santilli G, et al. BCR-ABL suppresses C/EBPα expression through inhibitory action of hnRNP E2. Nature genetics. 2002;30:48-58. Google Scholar Crossref
- Stehling-Sun S, Dade J, Nutt SL, DeKoter RP, Camargo FD. Regulation of lymphoid versus myeloid fate 'choice' by the transcription factor Mef2c. Nature immunology. 2009;10:289-96. Google Scholar Crossref
- Agatheeswaran S, Singh S, Biswas S, Biswas G, Chandra Pattnayak N,et al.,BCR-ABL mediated repression of miR-223 results in the activation of MEF2C and PTBP2 in chronic myeloid leukemia. Leukemia. 2013;27:1578-80. Google Scholar Crossref
