Research - Onkologia i Radioterapia ( 2020) Volume 14, Issue 3
Influencing factors of FEV1 and FVC for primary lung cancer patients
Jinseog Kim1, Rabindra Nath Das2*, Youngjo Lee3 and Sabyasachi Mukherjee42Department of Statistics, The University of Burdwan, Burdwan, West Bengal, India
3Department of Statistics, College of Natural Science, Seoul National University, Seoul, Korea
4Department of Mathematics, NSHM Knowledge Campus, Durgapur, West Bengal, India
Rabindra Nath Das, Department of Statistics, The University of Burdwan, Burdwan, West Bengal, India, Tel: 91-9232638970, Email: rabin.bwn@gmail.com
Received: 10-Dec-2019 Accepted: 17-Jan-2020 Published: 27-Jan-2020
Abstract
The determinants of FEV1 and FVC of 470 primary lung cancer patients with 17 characters who underwent major lung resections have been derived in the report. The mean FEV1 is positively associated with FVC (p<0.0001), and it is negatively associated with performance status at level 2 (p=0.0092), level 3 (p=0.0196), while its variance is positively associated with haemoptysis (p<0.0001), dyspnoea (p<0.0001), and it is negatively associated with FVC (p<0.0001), age (p<0.0001), performance status at level 2 (p<0.0001), level 3 (p<0.0001). On the other hand, mean FVC is negatively associated with age (P<0.0001), performance status at level 2 (p=0.0431), haemoptysis (p=0.0351), diabetes mellitus (p=0.0276), asthma (p<0.0001), while it is positively associated with diagnosis (p=0.0032) and cough (p=0.0676). Younger lung cancer patients with no advanced diseases such as asthma, diabetes mellitus, haemoptysis have higher FVC or FEV1. Care should be taken for advanced disease lung cancer patients during lung resection.
Keywords
Asthma, diabetes mellitus, forced expiratory volume in 1 second (FEV1), forced vital capacity (FVC), joint mean-variance modeling, non-small cell lung cancer
Introduction
The American College of Chest Physician, British Thoracic Society, and the European Respiratory Society guidelines present some outline criteria for investigating patients for lung cancer surgery [1-3]. There are some principal criteria such as age (lower), cardiovascular fitness (normal echocardiogram), pulmonary function (FEV1>1.5 litre for lobectomy, and>2.0 litre for pneumonectomy), nutrition and performance status in terms of operability, adjuvant therapy (stage I (cT1N0 and cT2N0) and stage II (cT1N1, cT2N1 and cT3N0) tumors lung cancer patients are considered operable), diagnosis and staging (patients having plain chest radiograph and a computed tomographic scan of the thorax along with the adrenal glands and liver are considered operable), locally advanced disease (special care to be taken with the discussion of physicians, surgeons, and oncologists), the operations available, and small cell lung cancer (for stage I small cell lung cancer) for fitness of lung resections surgery [4-7].
In lung resection surgery, pulmonary complications associated with patient’s physical condition and surgical procedure increases the mortality and morbidity of the patients. Therefore, in the preoperative examination, pulmonary complications risk assessment is a principal step [8-10]. Generally, for the suitability of lung surgery, FEV1(or FVC) to be high. However, smaller values of FEV1 and FVC invite many further respiratory function investigations [10-12]. It is known that FVC denotes the quantity of air that an individual can quickly and forcefully exhale after taking a deep breath, while FEV1 indicates the quantity of air that he/she can forcefully exhale in one second (1s) of the FVC test. Due to the occurrence of postoperative complications, unexpected changes related to the patient’s welfare and expected outcomes are frequently observed after a surgical technique. Generally, after a surgical method, pulmonary complications (postoperative) appear within thirty days. In practice, most surgical methods are associated with pulmonary functional changes such as mild, moderate and severe [10,12-14]. The most important perioperative morbidity cause is pulmonary complications [9,15].
It is known that normal pulmonary function of FEV1 and FVC is the most important factor related to the perfect lung resection surgery [1,2,12]. Recently, a review article [3] focuses on many determinants such as age, sex, weight, and height of FVC and FEV1. Many articles have tried to identify the determinants of FVC and FEV1 using multiple regression and meta-analysis which are not appropriate for modeling physiological data sets [7,8,12,16-20]. Relationship between lung function and diabetes mellitus, or asthma, or hemoptysis, or dyspnoea is a novel field of interest, which is very little studied in earlier articles [3,6,12,16,19]. Note that functional activities of FEV1 and FVC are controlled by many other factors that can only be identified based on probabilistic modeling. Best of our knowledge, very few earlier articles have focused on the causal factors of FEV1 and FVC for lung cancer patients using probabilistic models.
The report aims to identify the causal factors of FEV1 and FVC using Joint Generalized Linear Models (JGLMs). In the process, the associations and effects of the causal factors on FEV1 and FVC are derived.
Materials and Methods
Materials
The considered data set contains 470 primary lung cancer patients along with 17 explanatory characters, which is displayed in the UCI Machine Learning Repository. The present data set was obtained by Thoracic Surgery Centre (at Wroclaw in Poland) during the years 2007 to 2011, for 470 individuals who underwent lung resections surgery. The data source along with the collection method is displayed in [16]. There are 14-factors and 3-variables in the data set, where the 3 continuous variables are: 1. Forced vital capacity (FVC); 2. Age at surgery; 3. The volume that has an exhaled at the end of the first second of forced expiration (FEV1). The 14 attribute factors are 1. Diagnosis (DGN)-specific combination of ICD-10 codes for primary (=1), secondary (=2), and multiple tumors (=3) if any (DGN3, DGN2, DGN4, DGN6, DGN5, DGN8, DGN1); 2. Performance status in the Zubrod scale (PRZ) (PRZ2=3, PRZ1=2, PRZ0=1); 3. Haemoptysis before surgery (HBS) (True (T)=2, False(F)=1); 4. Pain BS (PBS) (T=2, F =1); 5. Dyspnoea BS (DBS) (T=2, F=1); 6. Weakness BS (WBS) (T=2, F=1); 7. 5. Cough BS (CBS) (T=2, F=1); 8. Size of the original tumor (SOT) (OC11=1 (smallest), OC12=2, OC13=3, OC14=4 (largest)); 9. Myocardial infarction (MI) up to 6 months (T=2, F=1); 10. Type-2 Diabetes mellitus (T2DM) (T=2, F=1); 11. Peripheral arterial disease (PAD) (T=2, F=1); 12. Asthma (T=2, F=1); 13. Smoking status (SMOK) (T=2, F=1); 14. One-year survival period after surgery (SURV) (T=2, F=1).
Statistical Methods
The interested study responses (FEV1 and FVC) are continuous, heteroscedastic and positive which are nonnormally distributed. Based on our knowledge, these two variables are very little studied according to their original nature such as heteroscedastic and non-normal, which can be analysed by variance stabilizing transformation if only the variance is stabilized under that transformation. Otherwise, they can be properly analysed by Joint Generalized Linear (JGL) Log-normal and Gamma models [21-23]. Two relevant studies of FVC and survival time for lung cancer patients are given in [18,24]. Both the responses FVC and FEV1 have been examined herein using JGLMs under Log-normal and Gamma distribution, and it has been observed that FVC has been fitted better under Gamma distribution, while FEV1 has been fitted well under Log-normal. These two models are given explicitly in [21,22], and for ready reference, they are shortly reproduced as follows.
JGL log-normal models: For a positive response random variable
yi’s with non-constant variance  (dispersion parameter),if
E(yi)=μi (mean parameter) and
(dispersion parameter),if
E(yi)=μi (mean parameter) and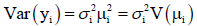 say, the log transformation zi=log(yi) is applied to stabilize the
variance
say, the log transformation zi=log(yi) is applied to stabilize the
variance  but the variance is not often stabilized.
Then, JGLMs for the mean and dispersion are adopted for an
improved model. Under the log-normal distribution, JGLM of
the mean and dispersion of zi=log(yi) are presented by
but the variance is not often stabilized.
Then, JGLMs for the mean and dispersion are adopted for an
improved model. Under the log-normal distribution, JGLM of
the mean and dispersion of zi=log(yi) are presented by 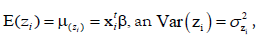 with
with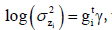 where
where  are the vectors of explanatory variables associated
respectively, along with the regression coefficients β (mean
model parameters) and γ (variance model parameters).
are the vectors of explanatory variables associated
respectively, along with the regression coefficients β (mean
model parameters) and γ (variance model parameters).
JGL gamma models: Practically, the GLM family distribution is
discriminated by V(μi), and it is Gamma if V(μ)=μ2, or Poisson
if V(μ)=μ, or Normal if V(μ)=1, etc. So, the JGLMs of mean
and the dispersion under Gamma distribution are 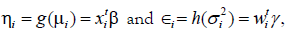 where
where are GLM link functions connected
respectively, with the mean and variance linear predictors, and
are GLM link functions connected
respectively, with the mean and variance linear predictors, and  are the explanatory factor vectors associated respectively,
with the mean and dispersion parameters. In practice, the
Maximum Likelihood (ML) and the restricted ML (REML)
method are used respectively, for estimating the mean and
dispersion parameters [21].
are the explanatory factor vectors associated respectively,
with the mean and dispersion parameters. In practice, the
Maximum Likelihood (ML) and the restricted ML (REML)
method are used respectively, for estimating the mean and
dispersion parameters [21].
Statistical and graphical analysis
Forced Vital Capacity (FVC) (separately FEV1) is considered as the interested response random variable, and the remaining 16 factors/ variables are considered as the explanatory variables. It is identified that FVC (separately FEV1) is heteroscedastic, and it has been modeled using both JGL Log-normal and Gamma models. Final fitted models are accepte based on the lowest Akaike Information Criterion (AIC) value (in each class), which reduces both the predicted additive errors and squared error loss [25]. Joint Gamma models fit (AIC=1090.655) for FVC gives better results than joint Log-normal fit (AIC=1094), while for FEV1, joint Log-normal models fit (AIC=1033) is better than joint Gamma models fit (AIC=1035.528). Note that all the included effects in both the FVC and FEV1 fitted models are not necessarily significant [23,25]. Also in epidemiology, partially significant effects, known as a confounder should be included in the model. In both mean and dispersion models, some confounders (partially significant) are included for better fitting. The final summary results of FVC and FEV1 are reported in Tables 1 and 2 respectively.
| Model | Covariate | Estimate | Standard error | t-value | p-value |
|---|---|---|---|---|---|
| Mean | Constant | 1.3008 | 0.21805 | 5.966 | <0.0001 |
| Diagnosis | 0.0478 | 0.01610 | 2.966 | 0.0032 | |
| Age | -0.0092 | 0.00136 | -6.733 | <0.0001 | |
| Size of tumour | 0.0281 | 0.01635 | 1.718 | 0.0864 | |
| Performance status (F2) | -0.0752 | 0.03707 | -2.028 | 0.0431 | |
| Performance (F3) | -0.0582 | 0.05839 | -0.996 | 0.3197 | |
| Pain BS | 0.0461 | 0.03906 | 1.181 | 0.2382 | |
| Haemoptysis BS | -0.0683 | 0.03231 | -2.114 | 0.0351 | |
| Dyspnoea BS | 0.0464 | 0.03815 | 1.216 | 0.2246 | |
| Cough BS | 0.0643 | 0.03511 | 1.832 | 0.0676 | |
| Diabetes mellitus | -0.0951 | 0.04307 | -2.209 | 0.0276 | |
| Asthma | -0.3059 | 0.04604 | -6.644 | <0.0001 | |
| Dispersion | Constant | -2.028 | 0.4765 | -4.256 | <0.0001 |
| Age | -0.011 | 0.0075 | -1.523 | 0.1284 | |
| Pain BS | -0.512 | 0.2786 | -1.837 | 0.0668 | |
| Dyspnoea BS | -0.440 | 0.2760 | -1.593 | 0.1118 | |
| Asthma | -2.874 | 1.6413 | -1.751 | 0.0806 | |
Table 1 : Results for mean and dispersion models for FVC from gamma fit
| Model | Covariate | Estimate | Standard error | t-value | p-value |
|---|---|---|---|---|---|
| Mean | Constant | 0.1826 | 0.10169 | 1.795 | 0.0733 |
| FVC | 0.2879 | 0.01001 | 28.775 | <0.0001 | |
| Age | -0.0016 | 0.00105 | -1.498 | 0.1348 | |
| Performance status (F2) | -0.1504 | 0.05757 | -2.612 | 0.0092 | |
| Performance status (F3) | -0.1474 | 0.06297 | -2.341 | 0.0196 | |
| Pain BS | 0.0487 | 0.03290 | 1.481 | 0.1392 | |
| Dyspnoea | 0.2642 | 0.18352 | 1.440 | 0.1505 | |
| Dispersion | Constant | 3.295 | 0.7784 | 4.234 | <0.0001 |
| FVC | -0.431 | 0.0840 | -5.134 | <0.0001 | |
| Age | -0.048 | 0.0103 | -4.690 | <0.0001 | |
| Performance status (F2) | -2.944 | 0.1758 | -16.746 | <0.0001 | |
| Performance status (F3) | -3.088 | 0,03400 | -9.084 | <0.0001 | |
| Haemoptysis BS | 1.310 | 0.1959 | 6.688 | <0.0001 | |
| Dyspnoea BS | 3.595 | 0.3041 | 11.822 | <0.0001 | |
| Smoker | 0.330 | 0.1904 | 1.733 | 0.08376 |
Table 2 : Results for mean and dispersion models of FEV1 from Lognormal fit
Data produced probabilistic model always should be checked by model diagnostic tools before concluding it as the final model, which predicts all valid interpretations. The derived FVC Gamma fitted models (Table 1) and FEV1 Log-normal fitted models have been verified by model checking plots by Figures 1 and 2, respectively. In Figure 1a, the FVC Gamma fitted (Table 1) absolute residuals are plotted against the fitted values, which is an exactly flat straight line, interpreting that variance is constant with the running means. Figure 1b displays the mean FVC fitted normal probability plot (Table 1), which does not reveal any sign of fit discrepancy. Therefore, both Figure 1a and 1b prove that the Gamma fitted FVC model fits well the data (Table 1). In Figure 2a, FEV1 Log-normal fitted (Table 2) absolute residuals are plotted against the fitted values, which is a flat straight line, implying that variance is constant with the running means. Figure 2b presents the mean FEV1 Log-normal fitted normal probability plot (Table 2), which shows no lack of fit. Thus, Figure 2a and 2b establish that the Log-normal fitted FEV1 model fits the data well (Table 2).

Figure 1. For the gamma fitted FVC model (Table 1), the (a) absolute residuals plot with respect to fitted values and (b) normal probability plot for mean model

Figure 2. For the Log-normal fitted FEV1 model (Table 2), the (a) absolute residuals plot with respect to fitted values and (b) normal probability plot for mean model
Results
FVC analysis results
The mean model of FVC (Table 1) shows the mean FVC is significantly negatively associated with age (p<0.0001), performance status at level 2 (p=0.0431), haemoptysis before surgery (p=0.0351), diabetes mellitus (p=0.0276), asthma (p<0.0001), while it is positively associated with diagnosis (p=0.0032), size of tumor (p=0.0864) and cough BS (p=0.0676). The variance model of FVC shows that the variance of FVC is negatively partially significantly associated with age (p=0.1284), pain BS (0.0668), dyspnoea (p=0.1178) and asthma (p=0.0806).
FEV1 analysis results
The mean model of FEV1 (in Table 2) shows the mean FEV1 is significantly positively associated with FEV (p<0.0001), while it is negatively associated with performance status at level 2 (p=0.0092) and at level 3 (p=0.0196) and age (p=0.1348) (partially). Variance model of FEV1 shows that the variance of FEV1 is negatively associated with FVC (p<0.0001), age (p<0.0001) and performance status at level 2 (p<0.0001) and at level 3 (p<0.0001), while it is positively associated with haemoptysis BS (p<0.0001), dyspnoea BS (p<0.0001) and smoking status (p=0.0837) (partially).
Discussion
The summarized results of FVC and FEV1 analyses are given in (Tables 1 and 2) respectively. From Table 1, it is observed that mean FVC (MFVC) is directly associated with diagnosis (DGN)-specific combination of ICD-10 codes for primary (=1), secondary (=2), and multiple tumors (=3) (p=0.0032), implying that FVC increases with the increased status of DGN. It is inversely associated with age (P<0.0001), indicating that FVC is lower at older age Lung Cancer Patients (LCPs) than younger. Therefore, thoracic surgery is more preferable at younger ages, but in practice lung cancer is frequently observed at older ages. Then more precautions are required. MFVC is inversely associated with Performance Status (PRZ) (PRZ2=3, PRZ1=2, PRZ0=1) at level (PRZ1) (p=0.0431), concluding that LCPs at level PRZ0 have higher FVC than at levels PRZ1, or PRZ2. It is inversely associated with Haemoptysis Before Surgery (HBS) (T=2, F=1) (p=0.0351), interpreting that LCPs with no HBS have significantly higher FVC than with HBS. It is inversely associated with Type 2 Diabetes Mellitus (T2DM) (T=2, F=1) (p=0.0276), indicating that LCPs with no T2DM have higher FVC than with T2DM. It is inversely associated with asthma (T=2, F=1) (p<0.0001), indicating that FVC is higher for the LCPs with no asthma than with asthma. It is partially directly associated with a Cough Before Surgery (CBS) (T=2, F=1) (p=0.0676), concluding that FVC is higher for LCPs with CBS than without CBS, while CBS is a confounder in the mean FVC model. MFVC is partially positively associated with the size of the tumor (p=0.0864), which is a confounder in the FVC mean model. The variance of FVC (VFVC) is partially inversely associated with Pain Before Surgery (PBS) (T=2, F=1) (p=0.0668), indicating that it is higher for LCPs with no PBS than with PBS. VFVC is partially inversely associated with asthma (T=2, F=1) (p=0.0806), concluding that it is higher for LCPs with no asthma than with asthma. It is partially inversely associated with Dyspnoea Before Surgery (DBS) (T=2, F=1) (p=0.1118), implying that it is higher for LCPs with no DBS than with DBS. Note that in the FVC variance model, all included covariates are confounder.
From Table 2, it is observed that mean FEV1 (MFEV1) is directly associated with FVC (p<0.0001), implying that it increases as FVC increases. It is inversely associated with performance status (PRZ) (PRZ2=3, PRZ1=2, PRZ0=1) at level (PRZ1) (p=0.0092) and level (PRZ2) (p=0.0196), implying that LCPs at level PRZ0 have higher FEV1 than at levels PRZ1 and PRZ2. The same conclusion is noted for FVC. MFEV1 is partially inversely associated with age (p=0.1348) (as confounder), indicating that FEV1 is lower at older age LCPs than younger. A similar interpretation is observed for FVC, while age is highly significant. In the mean FEV1 model, age, pain BS and dyspnoea BS are included as a confounder. The variance of FEV1 (VFEV1) is inversely associated with FVC (p<0.0001), concluding that it increases for LCPs as FVC decreases. It is inversely associated with age (p<0.0001), interpreting that VFEV1 is higher at younger age LCPs than at older age. VFEV1 is inversely associated with performance status (PRZ) (PRZ2=3, PRZ1=2, PRZ0=1) at level (PRZ1) (p<0.0001) and level (PRZ2) (p<0.0001), indicating that it is higher at level PRZ0 for LCPs than at levels PRZ1 and PRZ2. VFEV1 is directly correlated with HBS (T=2, F=1) (p<0.0001), indicating that VFEV1 is higher for LCPs with HBS than without HBS. It is directly associated with HBS (T=2, F=1) (p<0.0001), interpreting that VFEV1 is higher for LCPs with HBS than without HBS. It is directly associated with DBS (T=2, F=1) (p<0.0001), indicating that VFEV1 is higher for LCPs with DBS than without DBS.
It is derived herein that both mean FVC and FEV1 are inversely associated with age, implying that younger age is more preferable for lung surgery than older. Mean FEV1 is highly associated with FVC (Table 2), indicating that both FEV1 and FVC should be higher for lung resection surgery. Performance status is negatively associated with both mean FVC and FEV1. In addition, diseases haemoptysis, diabetes mellitus, and asthma are negatively associated with mean FVC, while diseases haemoptysis and dyspnoea are positively associated with the variance of FEV1. In addition, Myocardial Infarction (MI) up to 6 months and Peripheral Arterial Disease (PAD) are not identified as the influencing factors of FVC and FEV1. Many interesting results and interpretations are given above.
Lung functions predictive values are commonly computed from the values of anthropometric factors, such as age, sex, weight and height [3,6,12,15,19]. FEV1 and FVC values decline with age [3,12,19], which is supported by the present findings. The report has no findings regarding sex, height, and weight, as these covariates are not included in this data set. But a similar study [24] concludes that FEV1 is negatively associated with Body Mass Index (BMI) (p=0.0599), indicating that FEV1 value declines as BMI increases, while sex is insignificant. Some articles conclude that height and gender are the most important predictors of lung function, while age may be a confounder [3,19]. Here it is shown that age is highly significant for FVC mean model and is a confounder in FVC variance model (Table 1), but the scenery is completely reverse for FEV1 model (Table 2). Relationship between lung function and myocardial infarction, or peripheral arterial disease, or diabetes mellitus, or asthma, or haemoptysis, or dyspnoea is derived herein, which is very little studied in earlier articles [3,6,16,17,19]. Most of the earlier studies are based on multiple regression and meta-analysis, which are inefficient statistical methods for physiological heteroscedastic data analysis, and they may miss many significant factors. Moreover, very few articles have focused on the influencing factors of the variance of lung function. The current report focuses on many novel associations of lung function (both mean and variance) with age, performance status, dyspnoea, haemoptysis, diabetes mellitus, asthma, size of tumour, cough, chest pain, smoking status, etc., which are very little studied in earlier articles. So, present findings are little comparable with earlier articles.
Conclusion
The report has identified many causal factors of FVC for primary lung cancer patients based on JGLMs. Model fittings have been examined herein based on small AIC value, diagnostic plots, small standard errors of the estimates and comparison of the response distribution. The article has shown that lung cancer patients with no asthma, haemoptysis and diabetes mellitus and lower age have higher FVC and FEV1. Therefore, younger lung cancer patients are more preferable for lung resection surgery than older patients. But in practice, lung cancer patients are mostly observed at older ages. Medical practitioners need special care for older lung cancer patients, and along with advanced disease status of the patients. Every individual at an older age, and with advanced diseases such as diabetes mellitus, asthma, haemoptysis, dyspnoea should care on pulmonary functions regularly.
Conflict of Interest
The authors confirm that this article content has no conflict of interest.
References
- Lackey A, Donington JS. Surgical management of lung cancer. Semin Intervent Radiol. 2013;30:133-140.
- Rocco G, Internullo E, Cassivi SD, Van Raemdonck D, Ferguson MK. The variability of practice in minimally invasive thoracic surgery for pulmonary resections. Thorac Surg Clin. 2008;18:235-247.
- Barroso AT, Martín EM, Romero LMR, Ruiz FO. Factors affecting lung function: A review of the literature. Arch Bronconeumol. 2018;54:327-332.
- Harada H, Okada M, Sakamoto T, Matsuoka H, Tsubota N. Functional advantage after radical segmentectomy versus lobectomy for lung cancer. Ann Thorac Surg. 2005;80:2041-2045.
- Cerfolio RJ, Bryant AS. Surgical techniques and results for partial or circumferential sleeve resection of the pulmonary artery for patients with non-small cell lung cancer. Ann Thorac Surg. 2007;83:1971-1976.
- Cukic V, Baljic R. The most common detected risk and etiologic factors of pulmonary thromboembolism. Mat Soc Med. 2012;24:223-226.
- Hedenstierna G, Edmark L. Mechanisms of atelectasis in the perioperative period. Best Pract Res Clin Anaesthesiol. 2010;24:157-169.
- Valenza F, Chevallard G, Fossali T, Salice V, Pizzocri M, et al. Management of mechanical ventilation during laparoscopic surgery. Best Pract Res Clin Anaesthesiol. 2010;24:227-241.
- Degani-Costa LH, Faresin SM, Falcão LFR. Preoperative evaluation of the patient with pulmonary disease. Rev Bras Anestesiol. 2014;64:22-34.
- Duggan M, Kavanagh BP. Perioperative modifications of respiratory function. Best Pract Res Clin Anaesthesiol. 2010;24:145-155.
- Fernandez-Perez ER, Sprung J, Afessa B. Intraoperative ventilator settings and acute lung injury after elective surgery: a nested case-control study. Thorax. 2009;64:121-127.
- Kroenke K, Lawrence VA, Theroux JF, Tuley MR, Hilsenbeck S. Postoperative complications after thoracic and major abdominal surgery in patients with and without obstructive lung disease. Chest. 1993;104:1445-1451.
- Licker M, Diaper J, Villiger Y. Impact of intraoperative lung-protective interventions in patients undergoing lung cancer surgery. Crit Care. 2009;13:R41.
- Ng CS, Wan S, Yim AP, Arifi AA. Pulmonary dysfunction after cardiac surgery. Chest. 2002;121:1269-1277.
- Lawrence VA, Hilsenbeck SG, Mulrow CD, Dhanda R, Sapp J, et al. Incidence and hospital stay for cardiac and pulmonary complications after abdominal surgery. J Gen Intern Med. 1995;10:671-678.
- Zieba M, Tomczak JM, Lubicz M, Swiatek J. Boosted SVM for extracting rules from imbalanced data in application to prediction of the post-operative life expectancy in the lung cancer patients. Applied Soft Computing. 2014;14:99-108.
- Howington J. Saudi lung cancer prevention and screening guidelines. Ann Thorac Med. 2018;13:197.
- Das RN, Mukherjee S. Mean-variance overall survival time fitted models from stage III non-small cell lung cancer. Epidemiology (Sunnyvale). 2017;7:2-8.
- Ostrowski S, Barud W. Factors influencing lung function: Are the predicted values for spirometry reliable enough? J Physiology and Pharmacology. 2006;57(Supp 4):263-271.
- Hajjar WM, Alsheikh AM, Alhumaid AY, Alkreedees NA, Abdulwahed NB, et al. Pulmonary schistosomiasis in a young male: A case report and review of the literature. Ann Thorac Med. 2018;13:190-192.
- Lee Y, Nelder JA, Pawitan Y. Generalized linear models with random effects (Unified Analysis via H-likelihood) (2nd Ed). London: Chapman and Hall. 2017.
- Das RN, Lee Y. Log-normal versus gamma models for analyzing data from quality-improvement experiments. Quality Engineering. 2009;21:79-87.
- Das RN. Discrepancy in fitting between log-normal and gamma models: An illustration. Model Assisted Statistics and Applications. 2012;7:23-32.
- Das RN. Forced expiratory volume factors of stage III non-small cell lung cancer patients. Arch Gen Intern Med. 2017;1:3-7.
- Hastie T, Tibshirani R, Friedman J. The Elements of Statistical Learning (2nd Ed), Springer-Verlag, 2009.


