Research Article - Onkologia i Radioterapia ( 2025) Volume 19, Issue 10
FSA-UNet: A four-stage-attention UNet based semantic segmentation for breast cancer detection
Pothina Praveena* and N. Suresh KumarsPothina Praveena, Department of CSE, GIT, GITAM (Deemed to be University) andhra Pradesh, India, Email: ppothina@gitam.edu
Received: 01-Oct-2025, Manuscript No. OAR-25-161076; , Pre QC No. OAR-25-161076 (PQ); Editor assigned: 05-Oct-2025, Pre QC No. OAR-25-161076 (PQ); Reviewed: 19-Oct-2025, QC No. OAR-25-161076; Revised: 26-Oct-2025, Manuscript No. OAR-25-161076 (R); Published: 30-Oct-2025
Abstract
Breast cancer is a severe global health concern, accounting for a significant portion of the annual mortality rate among women. It now ranks first among female cancer cases globally, having a significant impact on both healthcare systems and society at large. This demonstrates clearly that early detection, precise diagnosis and appropriate disease management can all significantly improve the functioning of the healthcare facility. To address this, we offer a multi-attention-based UNet (FSAUNet). In particular, we suggest a residual encoder that enhances the backbone's fine-grained feature extraction capacity. It is built on a basic attention module. The underlying semantic representation of the provided feature map is reconstructed by applying multi-head self-attention on the lowest level feature, hence enabling fine-grained segmentation for various pixel categories. Then, to more accurately merge the feature data of the target across various scales, we employ channel attention and spatial attention during various feature fusion stages. This helps to address the issue of multiple scales in various categories. We also increase the number of down samplings to divide the target's feature sizes at different scales.
Keywords
Semantic segmentation; Breast cancer detection; FSA –UNet; CNN
Introduction
Breast cancer is a multifaceted and varied illness that poses a major public health challenge, impacting millions around the world every year. It is the most common cancer in women, underscoring the necessity for advanced research across various cultural, economic and geographical contexts. The epidemiological features of breast cancer reveal considerable genetic variations and a broad spectrum of clinical presentations, treatment responses and molecular characteristics, which defy simplistic classifications. Consequently, a comprehensive approach is essential to understand its pathophysiology and create effective treatments.
At the heart of breast cancer is the unchecked division of abnormal cells in the breast tissue. These malignant cells can invade nearby structures and spread to distant sites, greatly influencing patient prognosis and survival rates. The illness often progresses gradually, with its initial signs possibly consisting of minor changes in breast texture or even no symptoms at all, making regular screenings and educational initiatives vital for early detection.
In addition to its physical repercussions, breast cancer significantly affects a patient's emotional and psychological health, as well as their social interactions and family relationships. After receiving a diagnosis, patients frequently go through intense feelings of fear, anxiety and uncertainty. The treatment journey, which may include surgery, chemotherapy, radiation and hormonal treatments, can be both physically and emotionally draining. Furthermore, the high costs tied to breast cancer treatment can add additional stress for patients and their caregivers, worsening the emotional impact on mental health.
Despite notable progress in screening, diagnosis and treatment, breast cancer still presents a serious challenge. Although existing therapies have led to improved survival rates, issues such as drug resistance and the disease's inherent diversity continue to present significant obstacles. There remains an urgent need for ongoing research to discover new intervention targets, innovate management strategies and ultimately find a cure for breast cancer.
Materials and Methods
Early investigations into the pathology of breast cancer have centered on image analysis functions, particularly employing deep learning techniques to detect, categorize and pinpoint significant features such as nuclei and cell membranes in breast cancer images. A prominent deep learning framework, Her2Net, exhibited exceptional precision in assessing HER2, a protein associated with breast cancer [1]. This established a basis for further exploration into deep learning models aimed at precise mitosis detection and classification of breast cancer. One approach that employed handcrafted features and image preprocessing achieved a remarkable F1-score of 94.38% and an accuracy of 94%, while an end-to-end semantic model exceeded 95% accuracy and had a Dice index of 0.6 [2].
Deep learning applications have also made strides in the analysis of mammograms, showing significant success in tumor detection and segmentation. A computer-aided system that utilized deep learning demonstrated impressive predictive capabilities for tumor localization and segmentation, achieving average Area under the Curve (AUC) values of 0.98 and 0.95 across different frameworks [3]. Following this, the UNet model was created to automate the evaluation of breast cancer in mammograms, resulting in enhanced performance in detecting, segmenting and classifying breast masses compared to earlier models [4].
In addition to mammograms, breast ultrasound image classification has advanced due to the use of deep learning techniques. The combination of fuzzy logic and deep learning for automatic tumor segmentation yielded improved quantitative results over CNNbased segmentation when analyzing multiple cases simultaneously [5]. Another research study introduced the Dilated Semantic Segmentation Network (Di-CNN) for the segmentation of breast lesions in ultrasounds, showing superior diagnostic effectiveness compared to current algorithms [6].
Ensemble models have been investigated as well, with an Ensemble-Net model leveraging pre-trained CNN architectures to delineate the margin of the pectoral muscle and classify breast tumors with an accuracy of 96.72% [7]. Further progress is noted with the Unet3+ model for breast cancer diagnostics, which achieved an average Intersection-Over-Union (IoU) of 52, a recall rate of 57% and an accuracy of 82.53% [8].
Additionally, pixel-wise segmentation techniques, such as the GLPCNM10 dilation model, have shown better performance than others in diagnosing tumors in mammography [9]. Despite these advancements, several challenges persist, including a lack of sufficient training data, class imbalance, challenges in detecting breast lymph nodes and identifying cancer in dense breast tissue. Overcoming these obstacles is essential for the creation of effective deep learning models that can facilitate early-stage breast cancer diagnoses. A study concentrating on deep learning-based breast cancer segmentation using contrast-enhanced MRI images pointed out difficulties like poor image quality at initial stages and the necessity for additional research to address these challenges [10].
The architecture of our model fundamentally relies on the UNet, which features a classic encoder-decoder structure. In this configuration, the encoder produces feature maps with reduced resolutions through sequential convolutions and down sampling, resulting in compact, high-dimensional semantic representations. The decoder then progressively upsamples these feature maps back to their original dimensions to create the final segmentation output. UNet is composed of five scales of feature maps, with the first four being up sampled during the decoding phase and merged with lower-level features through skip connections. The lowest feature map is down sampled by a factor of 16, capturing highdimensional semantic characteristics. After incorporating features and upsampling, the segmented image is generated. The UNet architecture is illustrated in Figure 1.

Fig. 1. The structure of UNet; BN in the figure represents batch normalization.
Building on this, we present the Multi-Attention UNet (MAUNet), which integrates multiple sophisticated attention modules layered over the basic UNet structure. In this section, we will first give an overview of the MA-UNet architecture, then detail each attention module and its function, concluding with a discussion on a modified loss function.
Structure of FSA-UNet
We present FSA-UNet, which incorporates four attention modules derived from the UNet architecture. To enhance the backbone's capacity to extract target features, we developed an attention-based residual encoder that combines a residual structure with a simple attention module (simAM). Rather than employing max pooling for downsampling, we utilized a 3 × 3 convolution with a stride of 2 and padding of 1. This alteration decreases detail loss during the downsampling process and increases the number of downsampling iterations (from 16 to 32), thereby boosting the network's ability to extract large-scale features.
To improve the semantic representation of every feature point, we implement multi-head self-attention at the lowest feature level. Unlike traditional encoder-decoder architectures, the MA-UNet enhances feature fusion by applying attention to the features after the skip connections. Spatial attention is utilized for merging the fused features at the first three scales because shallow features, which exhibit larger feature map resolutions and spatial feature dispersion, significantly influence feature fusion. For the final two scales, channel attention is employed to combine the fused features, as high-dimensional features are generally condensed into channels.
The entire architecture of MA-UNet is depicted in Figure 2 and the subsequent subsections offer a thorough examination of each attention module incorporated into the network.

Fig. 2. The structure of MA-UNet; LN in the figure represents layer normalization and BN represents batch normalization.
Residual encoder based on attention
Due to the network's deepening, the residual structure initially surfaced in ResNet, where it successfully solved issues including disappearance of gradients and gradient explosion. There are two types of structures that are often available: the enhanced bottleneck structure of the residual and the regular residual structure (Figure 3). Due to the fact that MA-UNet falsely improves the network depth by increasing the number of down samplings once, the gradient disappearing process must be delayed during backpropagation using the residual structure.

Fig. 3. The structure of residual block. (a) The ordinary residual structure; (b) The improved bottleneck structure of the residual. C and BN in the figure represent number of channels and batch normalization, respectively.
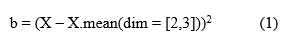
While the bottleneck-based residual structure minimizes the number of operations, we opted for the standard residual structure since MA-UNet does not stack many residual layers and the original UNet encoder employs two 3 × 3 convolutions for every feature layer scale. Since the residual structure by itself is unable to considerably enhance the encoder's feature extraction performance, we added a basic parameter-free attention module (simAM) to the residual structure in order to stop the encoder's computational load from increasing further. The significance of every neuron must be assessed once the feature map is convolved and simAM deduces the attention weights from the energy function. The methodology is as follows in specifics:
Equation (1) illustrates how we get the feature space mean b from the input feature map X;
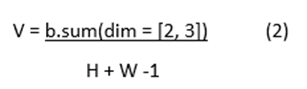
Using the feature space mean b as a base, we calculate the variance of the feature map's width and height in its channel direction, as indicated by Equation (2);
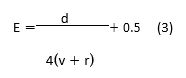
Using Equation (3), where q is the energy factor, we derive the feature map's energy distribution;
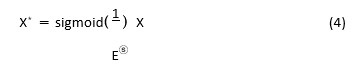
At last, the improved feature map is produced, as indicated by equation (4).
As illustrated in Figure 4, the residual structure based on simAM is created by incorporating simAM behind the 3 × 3 convolution kernel in the residual structure. In the end, the MA-UNet encoder is made up of five simAM-based residual blocks and five convolution kernels with step sizes of 2.

Fig. 4. The structure of the residual, based on simAM.
Feature map reconstruction based on multi-head self-attention
For an image with an input size of 256 256 3, the final feature map size was 8 8 512 or only 64 pixels per dimension and the perceptual area, corresponding to the higher dimensional features, was rather large after 5 convolutions and 5 down-sampling procedures. We used Multi-head Self-Attention (MSA) to reconstruct the feature map in order to further enhance the correlation and globalisation between the feature locations. In this particular approach, the input vector was sent through the fully connected layer and three vectors were generated: a query vector, a key vector and a value vector.
Every candidate location has two key vectors and two value vectors; the query vector queries each candidate location to discover the vector that has the strongest connection to itself.
Completing the dot product of this vector with the key vectors of each potential position is the querying procedure. After SoftMax activation, the dot product operation result was weighted to the corresponding value vectors and summation was used to get the final result.
The foundation of MSA is self-attention with many heads, which allows for parallelism and increases operational efficiency. Figure 5 depicts the self-attention method, the MSA process.

Fig. 5. Structure of the self-attention mechanism; (b) Structure of the MSA mechanism.
Equation (5) provides an expression for the final attention factor achieved.

Equations (6) and (7) can be used to express the attention of multihead parallel computing.
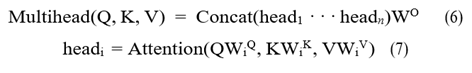
MSA accepts two-dimensional matrix vectors as input and output. This must be applied to the segmentation problem by flattening the feature map into a two-dimensional feature matrix. The particular method was to flatten the final 8 × 8 × 512 feature map while maintaining the channel dimensions. The result is still a 512 × 64 2D matrix even after layer normalization and MSA were used to reconstruct the features. Finally, the feature map was reshaped to its original size. In Figure 6, the general structure is displayed.

Fig. 6. The structure of MSA appling to image features rebuilding.
Feature fusion based on attention enhancement
The feature map is resized to its original size by the decoder during the decoding stage, after which the segmentation result is obtained. After a series of upsampling and convolution operations, the number of channels is finally decreased to a given amount by 1 × 1 convolution to generate the segmentation map. The original UNet decoder is composed of bilinear interpolation, feature fusion and two 3 × 3 convolution layers. Throughout the feature fusion stage, we enhanced the fused features using an attention module and up-sampled using transposed convolution rather than bilinear interpolation. We contend that the features of targets at different scales can be readily confused by the straightforward combination of high dimensional features following upsampling, particularly when their boundaries are close together and their shapes are hazy and uneven. In order to improve recognition skills and reinforce the differences between targets on different scales, as well as to improve the characteristics between various target classes, we created an attention improvement module. The three largest scale feature maps require a Spatial Attention Module (SAM) for combining the fused features since the shallow level feature map's relatively large resolution has a stronger impact on the spatial feature distribution. The fused features are specifically extracted again by convolution procedures and the resultant convolved feature maps are averaged and maxed in the channel dimension. Next, convolution and sigmoid activation are performed to obtain the spatial weight coefficients and, to create an improved feature map, the spatial weight coefficients are finally multiplied by the initial feature map. Since channels in high-dimensional features are frequently compressed, a Channel Attention Module (CAM) is utilised to integrate the fused features for the final two smaller scale feature maps. In particular, a convolution technique was employed to further extract the fused features initially. The channel weight coefficients were obtained using linear mapping, summation and the activation function. Then, the channel weight coefficients were multiplied by the original feature map to produce the improved feature map. Figure 7 displays the SAM and CAM structures.

Fig. 7. Feature enhancement based on SAM and CAM.
Improved loss function
The sample size for the segmentation task is equal to the total number of pixel points in each category. When the number of categories is high, different categories frequently have unequal sample sizes, which causes the model to be more biassed towards predicting the categories with more samples, resulting in a lower prediction loss. The segmentation effect for a group having fewer samples is rendered less accurate by such prediction findings and the accuracies of other categories are deceitfully reduced when the pixels of the group with less samples are incorrectly placed into other categories. Each category's total number of pixel points serves as the sample size for the segmentation task. varying categories often have varying sample sizes when there are a lot of categories. This leads to a bias in the model towards predicting the categories with more samples, which lowers the prediction loss. Such prediction findings diminish the accuracy of the segmentation effect for a category with fewer data and deceitfully reduce the accuracy of other categories when the pixels of the category with less samples are wrongly allocated into other categories.
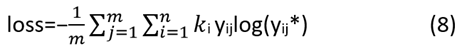
where n is the number of categories, m is the number of sample points, ki is the weight assigned to the current category, yji is the current sample point's category number and y*ji is the classification probability that the network predicts for the current sample.
Results
Dataset information
Between 2007 and 2009, DICOM-formatted DCE-MRI images were gathered from 400 participants. After omitting individuals with prosthetics, breast implants or incomplete information, a total of 285 patients remained for further analysis [11]. In a careful assessment of the dataset, six radiologists identified and excluded 13 patients who either had implants or lacked a confirmed tumor, resulting in 272 cases for the study.
The Jules Bordet Institute located in Brussels, Belgium, prospectively compiled a breast MRI database to support this research [12]. This investigation centered on 43 adult patients diagnosed with breast cancer, all having tumors larger than 2 cm and undergoing preoperative treatment. The imaging sessions, both pre and posttreatment, took place from 2002 to 2010, leading to the collection of 86 volumes. After the initial round of chemotherapy, all tumors became visible, with their size and intensity undergoing gradual changes. The age range of the patients varied from 25 to 82, with an average age of 51. During the model training phase, it was effectively trained using data from 30 patients, which amounted to 60 volumes. The remaining 13 patients contributed 26 volumes for testing, bringing the overall total to 86 volumes.
The dataset was acquired utilizing a Siemens 1.5T MRI scanner, with an interventional radiologist providing labels for each breast cancer case to establish the ground truth necessary for supervised machine learning models like UNet, SegNet and the proposed model. Following the image acquisition, a bias field correction filter was employed [13] and the breast tissue containing cancer was designated as the area of interest [14].
Experimental setup
Python, utilizing the CUDA device, is the chosen programming language for training and testing the models. The device is currently available in version 5.0. The Adam optimizer was used to enhance the model during the training process. The stochastic gradient descent loss function was optimized, employing a learning rate of 1e-4 along with cross-entropy. Training the models on an NVIDIA GTX Titan X GPU with cuDNN v5.0 takes approximately six hours. Moreover, the proposed UNet architecture enables networks to be trained on GPUs with a minimum of 3GB of RAM. While the dimensions of the volumes in the processed datasets make it challenging to perform dense training on entire volumes for this architecture size, conducting dense perception on full volumes remains feasible as it only necessitates a forward pass, thus requiring less storage. Consequently, volume segmentation demands 12 Gigabytes of GPU memory and takes around 30 seconds.
Metrics and formulas used in this experiment are as follows:
The Positive Prediction Value (PPV), also known as Precision, is defined as the amount of pixels that were produced in segmented images those are genuinely positive The equation for PPV is given by
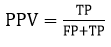
where TP stands for True Positives and FP stands for False Positives. The F1-score is used to assess the accuracy of a network structure for a given input image. It is calculated using the formula
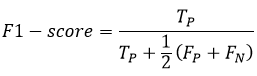
Sensitivity (SE) or Recall, measures the proportion of actual positives that are correctly identified by the segmentation technique. It is expressed as:
Accuracy (ACC) represents the frequency of correctly segmented input images. The formula for accuracy is
The Negative Prediction Value (NPV) is the amount of pixels that were produced in segmented images that are genuinely negative. It is calculated as:
Specificity (SP) evaluates the specificity of unfavorable outcomes by measuring the segmentation of input images. The equation for specificity is
Discussion
For this section, we carried out evaluations using both qualitative and quantitative approaches. A selection of sample images from the dataset, along with a depiction of their appearances for both gigantic and non-massive tumors. The quantitative method includes a statistical quality measurement component. Qualitative analysis focuses on the aesthetic quality of the outcomes. The Dice score was selected as the metric to evaluate the effectiveness of the proposed model. In addition to the three performance metrics utilized by previous leading methods, we applied extra metrics to enhance the explanation of our proposed model: Accuracy (IoU), Loss (Binary Cross Entropy) and p-value. Table 1 presents descriptions and equations for the additional measures. A comparison of the proposed model and the current state-ofthe-art methods is quantitatively analyzed. The Dice score, which has a mathematical representation, indicates the level of similarity between sets R and S.
| Model | p-Value (U-test) | Accuracy (IoU) | Loss (Binary cross entropy) |
| UNet | 0.052(<0.05) | 68.88 | 0.062 |
| SegNet | 0.147 (>0.05) | 65.16 | 0.053 |
| DMFTNet | 0.045 (<0.05) | 76.14 | 0.002 |
| DAH-Unet | 0.147 (>0.05) | 65.16 | 0.053 |
| FSA-UNet | 0.025 (<0.05) | 80.43 | 0.022 |
Tab. 1. Metrics in comparison with reference paper.
Fifteen percent of the total dataset was allocated to evaluate the performance of the model, while the remaining eighty-five percent was dedicated to training and validation. By implementing a twofold cross-validation process, it was ensured that the model was neither over fitted nor under fitted. The performances were assessed using the one-sided Mann–Whitney U test [15], a non-parametric method that evaluates whether the two samples (true labels and predicted segmentations) come from the same population without assuming a normal distribution. A threshold of 0.05 was set to either accept or reject the null hypothesis at a 95 percent confidence level. The accuracy of the model is determined by dividing the number of correctly predicted categories by the total predictions made. Although this is one way to evaluate a model's performance, it is not the only method. As shown in Table 2, the loss values obtained from using UNet, SegNet and DMFTNet are 0.062, 0.002 and 0.053, respectively. A statistical metric known as the p-value is used to examine a hypothesis against the available data. A p-value represents the likelihood of observing the resultant data assuming the null hypothesis is true. As the p-value decreases, the statistical significance of the observed difference increases. According to Table 2, the p-values associated with UNet, SegNet and DMFTNet are 0.052 (<0.05), 0.147 (>0.05) and 0.045 (<0.05), respectively. The accuracy figure obtained during testing with DMFTNet suggests that the model's predictions align closely with the actual data (Figures 8 and 9).
| Model | PPV | NPV | SE | SP | AC | F1 |
| UNet [21] | 0.762 | 0.612 | 0.712 | 0.776 | 68.88 | 0.826 |
| 3DU-Net [38] | 0.753 | 0.635 | 0.739 | 0.789 | 65.16 | 0.845 |
| Ensemble Net [39] | 0.732 | 0.653 | 0.762 | 0.799 | 76.14 | 0.861 |
| FSA-UNet | 0.715 | 0.676 | 0.78 | 0.811 | 77.18 | 0.866 |
Tab. 2. Various Nets and respective metrics.

Fig. 8. Sample dataset: a) Mass tumor, b) Non-mass tumor.

Fig. 9. Results of proposed and other architectures, From left to right: Input image, ground truth, DMFTNet, DAH-Unet and FSA-UNet.
Measure of performance in relation to other metrics
The summative assessments utilized to evaluate the development of the proposed DMFTNet. Sensitivity refers to the proportion of true positives correctly identified by a medical examination, indicating the test's capability to accurately diagnose a disease. Specificity reflects the percentage of true negatives that a diagnostic assessment accurately predicts, highlighting the ability of the test to identify neutral or adverse conditions. Accuracy is defined as the ratio of actual outcomes, whether positive or negative, within a sample, serving as a measure of a diagnostic test's precision for a specific condition. The comparison of the performance of prior models against the proposed FSA-UNet method in terms of accuracy. Consistent with, the proposed FSA-UNet demonstrates superior performance across various criteria.
The qualitative method is equally important in this paper as the quantitative approach. Therefore, we carried out a qualitative assessment. Employing FSA-UNet, DAH-Unet and DMFTNet, the visual correlation between the predicted segmented images and the actual ground truth is illustrated for four different cases. It is evident that the areas predicted by the proposed Net closely align with the real data. Additionally, one can compare the visual quality performance of DMFTNet with that of FSA-UNet. The DMFTNet incorrectly categorizes several undesirable areas as large tumors, stemming from misclassification of tumor regions. There are multiple similarities between FSA-UNet and the ground truth. The DMFTNet model's performance in identifying mass areas is lacking when it comes to overall region detection. In contrast, FSA-UNet has adequately covered most of the impacted area. The notable agreement between the proposed model and the actual conditions highlights the high quality of the suggested FSA-UNet architecture.
Conclusion
In this research, we introduced a new deep learning framework, FSA-UNet, for detecting breast cancer and performing semantic segmentation in MRI images. Our method utilizes a four-stage attention mechanism, integrating a residual encoder, multi-head self-attention, spatial attention and channel attention to enhance feature extraction and fusion. The experimental findings indicate that FSA-UNet surpasses leading models, achieving an accuracy of 80.43%, a Dice score of 0.866 and a p-value of 0.025. The qualitative assessment further reveals that FSA-UNet yields more precise and robust segmentation outcomes compared to other models. This study aids in the progression of more efficient and effective breast cancer detection and diagnostic techniques that have the potential to enhance patient outcomes and save lives. Future research will aim to investigate the extension of FSA-UNet to other medical imaging modalities and to enhance its performance with larger datasets and more sophisticated techniques.
References
- Saha M, Chakraborty C. Her2Net: A deep framework for semantic segmentation and classification of cell membranes and nuclei in breast cancer evaluation. IEEE Transa Image Process. 2018; 27:2189-2200.
[Crossref] [Google Scholar] [PubMed]
- Jiménez G, Racoceanu D. Deep learning for semantic segmentation vs. classification in computational pathology: Application to mitosis analysis in breast cancer grading. Front bioeng biotechnol. 2019; 7:145.
[Crossref] [Google Scholar] [PubMed]
- Ahmed L, Iqbal MM, Aldabbas H, Khalid S, Saleem Y, et al. Images data practices for semantic segmentation of breast cancer using deep neural network. J Ambient Intell Humaniz Comput. 2023; 14:15227-15243.
- Soulami KB, Kaabouch N, Saidi MN, Tamtaoui A. Breast cancer: One-stage automated detection, segmentation, and classification of digital mammograms using UNet model based-semantic segmentation. Biomed Signal Process Control. 2021; 66:102481.
- Badawy SM, Mohamed AE, Hefnawy AA, Zidan HE, GadAllah MT, et al. Automatic semantic segmentation of breast tumors in ultrasound images based on combining fuzzy logic and deep learning-A feasibility study. PloS One. 2021; 16:0251899.
[Crossref] [Google Scholar] [PubMed]
- Irfan R, Almazroi AA, Rauf HT, DamaševiÄius R, Nasr EA, et al. Dilated semantic segmentation for breast ultrasonic lesion detection using parallel feature fusion. Diagnostics. 2021; 11:1212.
[Crossref] [Google Scholar] [PubMed]
- Nagalakshmi T. Breast cancer semantic segmentation for accurate breast cancer detection with an ensemble deep neural network. Neural Process Lett. 2022; 54:5185-5198.
- Alam T, Shia WC, Hsu FR, Hassan T. Improving breast cancer detection and diagnosis through semantic segmentation using the Unet3+ deep learning framework. Biomedicines. 2023; 11:1536.
[Crossref] [Google Scholar] [PubMed]
- Khan SU, Wang F, Liou JJ, Liu Y. Segmentation of breast tumors using cutting-edge semantic segmentation models. Comput Methods Biomech Biomed. 2023; 11:242-252.
- Karri C, Santinha J, Papanikolaou N. A short review: Semantic segmentation for breast cancer detection in MRI images. IETE J Res Pract. 2024; 70:5666-5680.
- Wang M, Sun C, Sowmya A. Efficient corner detection based on corner enhancement filters. Digital Signal Processing. 2022; 122:103364.
- Dedeurwaerder S, Desmedt C, Calonne E. Largest ever DNA methylation dataset for breast cancer completed. Expert Rev Mol Diagn. 2011; 11:470.
[Google Scholar] [PubMed]
- Pena-Reyes CA, Sipper M. A fuzzy-genetic approach to breast cancer diagnosis. Artif Intell Med. 1999;17:131-155.
[Google Scholar] [PubMed]
- Piao Y, Ji W, Li J, Zhang M, Lu H. Depth-induced multi-scale recurrent attention network for saliency detection. InProceedings of the IEEE/CVF international conference on computer vision 2019; 7254-7263.
- Noh H, Hong S, Han B. Learning deconvolution network for semantic segmentation. InProceedings of the IEEE international conference on computer vision 2015; 1520-1528.


