Research Article - Onkologia i Radioterapia ( 2023) Volume 17, Issue 9
Evaluation of serum cystatin C in Systemic Lupus Erythematosus (SLE) with and without clinically evident nephritis
Tiba Mohammed Shakir1*, Raid Jassim Mohamed2 and Jalal Abed Altaai32Assistant Professor, Ph.D. in Medical Chemistry, Department of Chemistry and Biochemistry, College of Medicine, Al-Nahrain University, Baghdad, Iraq
3Lecturer, Department of Internal Medicine, College of Medicine, Al-Nahrain University, Baghdad, Iraq
Tiba Mohammed Shakir, B.Sc. in Chemistry, Department of Chemistry and Biochemistry, College of Medicine, Al-Nahrain University, Baghdad, Iraq, Email: tiba.alsaify@gmail.com
Received: 22-Aug-2023, Manuscript No. OAR-23-111097; Accepted: 10-Sep-2023, Pre QC No. OAR-23-111097 (PQ); Editor assigned: 24-Aug-2023, Pre QC No. OAR-23-111097 (PQ); Reviewed: 30-Aug-2023, QC No. OAR-23-111097 (Q); Revised: 07-Sep-2023, Manuscript No. OAR-23-111097 (R); Published: 19-Sep-2023
Abstract
Is an autoimmune, multi-system, chronic, inflammatory, and fatal disease, with different clinical manifestations that have been identified as a common and significant health challenge worldwide. This disease is a disorder of unknown origin that affects several organs and causes various tissue harm by producing and depositing autoantibodies and pathogen immune complexes in tissues and cells. Systemic Lupus Erythematosus has adverse effects on various physical, mental, and social dimensions of patients’ health and reduces their quality of life. The process of SLE pathogenesis can cause multiple tissue and organ damage. When the kidney is involved, this condition can lead to lupus nephritis. LN (Lupus Nephritis) occurs in about 40% of SLE patients, mostly within 5 years from the diagnosis, and still presents a rate of progression to End-Stage Renal Disease (ESRD) of (4.3%-10.1%). Renal failure, along with infections, cancer, and cardiovascular events, is one of the most common causes of death in SLE patients. Cystatin C is a small-molecular-weight endogenous protein that belongs to the cysteine protease inhibitors, produced by all nucleated cells at a relatively constant rate. Serum cystatin C reliably detects renal dysfunction in patients with various renal diseases including SLE.
Keywords
cystatin c, systemic lupus erythematosus, nephritis
Introduction
Systemic Lupus Erythematosus (SLE) is a chronic autoimmune inflammatory syndrome involving genetic, epigenetic, hormonal, environmental, and immune-regulatory factors. Onset occurs commonly in women of reproductive age, in the third and fourth decades of life, with a male: female ratio of about 1:10. The development of a high level of autoantibodies targeted nuclear antigens characterizes SLE, the piling up autoantibodies in the tissue of organ and the development of immune complexes cause the output of cells from the immune system that maintain a strong response loop that damages the body organs [1]. The clinical course of the disease is unpredictable with periods of remission and flares. During the course of the disease organs throughout the body, such as joints skin, heart, kidney, or nervous and vascular systems, may be damaged. This aspect, together with the variety of autoantibodies detected in SLE patients, brings around the debate about whether SLE is one single disease with several phenotypes or a similar [2]. Cystatin C is a member of the cystatin superfamily of cysteine protease inhibitors. Cystatin C is widely distributed in different organs and tissues and, in view of its relatively small molecular weight and easy detection, is also used as a marker of glomerular filtration rate. Unlike other renal biomarkers, e.g., serum creatinine, cystatin C is less susceptible to biological interference and more sensitive to early deterioration in renal function [3].
Materials and Methods
A case-control study that included 120 patients with Systemic Lupus Erythematosus and was conducted in the Department of Chemistry and Biochemistry at the College of Medicine at AlNahrain University, The Outpatient Clinic of Internal Medicine at Al-Immamain Al-kadhmain Medical City, and Medical City/ Ghazi Al-Hariri Surgical Specialities Hospital during the period between February to August 2023.
The study protocol was approved by the Ethical Committee of the College of Medicine, Al-Nahrain University.
The participants included (60 patients) of Systemic lupus erythematosus with Nephritis, and (60 patients) of Systemic lupus erythematosus without clinically evident Nephritis, aged 18 years-65 years. Each participant was subjected to a physical examination. All individuals had their height and weight measured. The Body Mass Index (BMI) was calculated in kilograms per square meter.
Venous Blood samples (5 mL) will be used for patients with Systemic Lupus Erythematosus. Each sample was divided into two aliquots: 3 mL in a plain tube where the serum was separated and incubated at -20ºC until it was used. The other 2 mL was placed in EDTA tubes for erythrocyte Sedimentation Rate (ESR). Control should be age and sex-matched (Table 1).
Tab. 1. Descripti e analysis of Age and BMI with t-test comparison between the two study groups (SLE and LN)
| Parameters | Subjects | N | Median | Mean± SD | SEM | P values |
|---|---|---|---|---|---|---|
| Age | LN | 60 | 32 | 32.77± 9.99 | 1.29 | 0.74 |
| SLE | 60 | 34 | 33.40± 10.99 | 1.42 | ||
| BMI kg/m2 | LN | 60 | 30 | 30.35± 6.23 | 0.8 | 0.37 |
| SLE | 60 | 29 | 29.40± 5.34 | 0.69 |
Results
Demographic and clinical criteria
Age:
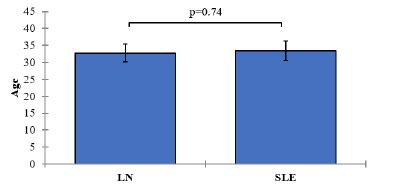
The mean age of subjects in the SLE group without clinically evident nephritis was 33.40 years (SD=10.99), while in the SLE group with clinically evident nephritis, the mean age was 32.77 years (SD=9.99). The p-value associated with the comparison of age between the two groups was 0.74, indicating no statistically significant difference in age between the SLE groups. Figure 1.
Figure 1: Mean values of Age with 95% confidence intervals by groups of the study Showing P-value of the two independent t-test comparisons.
BMI (Body Mass Index) kg/m2 :
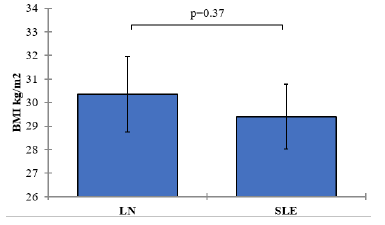
The mean BMI in the SLE group without clinically evident nephritis was 29.40 kg/m2 (SD=5.34), while in the SLE group with clinically evident nephritis, it was 30.35 kg/m2 (SD=6.23). The p-value associated with the comparison of BMI between the two groups was 0.37, suggesting no statistically significant difference in BMI between the SLE groups Figure 2.
Figure 2: Mean values of BMI with 95% confidence intervals by groups of the study Showing P-value of the two independent ttest comparisons
Biochemical marks
Cystatin C (CYS-C) Levels:
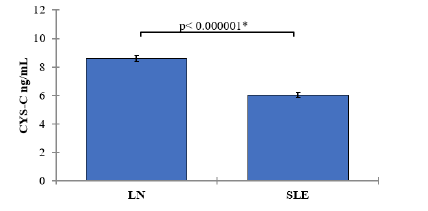
In the LN group, the mean CYS-C level was 8.58 ng/mL (SD=0.81). In the SLE group, the mean CYS-C level was 6.02 ng/mL (SD=0.71). The comparison of CYS-C levels between the LN and SLE groups yielded a p-value of <0.000001, indicating a statistically significant difference. SLE patients with nephritis showed significantly lower CYS-C levels compared to those without nephritis (Table 2 and Figure 3).
Tab. 2. Descripti e analysis of biochemical parameters with t-test comparison between the two study groups (SLE and LN)
| Parameters | Subjects | N | Median | Mean± SD | SEM | P values |
|---|---|---|---|---|---|---|
| CYS-C ng/mL | LN | 60 | 8.52 | 8.58± 0.81 | 0.1 | < 0.000001 |
Figure 3: Mean values of CYS-C with 95% confidence intervals by groups of the study Showing P-value of the two independent t-test comparisons
Immunological parameters
Antinuclear Antibody (ANA) Levels:
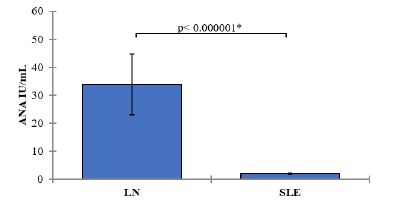
In the group of SLE patients with clinically evident nephritis (LN group), the mean ANA level was 33.86 IU/mL (SD=41.75). In the SLE group without clinically evident nephritis, the mean ANA level was 1.97 IU/mL (SD=1.04). The comparison of ANA levels between the LN and SLE groups yielded a p-value of <0.000001, indicating a statistically significant difference. SLE patients with nephritis exhibited significantly higher ANA levels compared to those without nephritis Table 3 and Figure 4.
Tab. 3. Descripti e analysis of Immunological parameters with t-test comparison between the two study groups (SLE and LN)
| Parameters | Subjects | N | Median | Mean± SD | SEM | P values |
|---|---|---|---|---|---|---|
| ANA IU/mL | LN | 60 | 28.6 | 33.86± 41.75 | 5.39 | < 0.000001 |
| SLE | 60 | 2.1 | 1.97± 1.04 | 0.13 | ||
| dsDNA U/mL | LN | 60 | 135.45 | 178.23± 188.91 | 24.39 | < 0.000001 |
| SLE | 60 | 38.75 | 43.68± 20.30 | 2.62 | ||
| C3 g/L | LN | 60 | 1.1 | 1.03± 0.38 | 0.05 | 0.004 |
| SLE | 60 | 1.28 | 1.23± 0.38 | 0.05 | ||
| C4 g/L | LN | 60 | 0.3 | 0.28± 0.17 | 0.02 | 0.004 |
Figure 4: Mean values of Antinuclear Antibody (ANA) Levels with 95% confidence intervals by groups of the study Showing the P-value of the two independent t-test comparisons
Double-Stranded DNA (dsDNA) Levels:
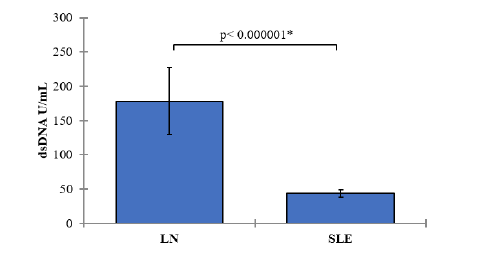
In the LN group, the mean dsDNA level was 178.23 U/mL (SD=188.91). In the SLE group, the mean dsDNA level was 43.68 U/mL (SD=20.30). The comparison of dsDNA levels between the LN and SLE groups resulted in a p-value of <0.000001, signifying a statistically significant difference. SLE patients with nephritis demonstrated significantly higher dsDNA levels compared to those without nephritis Figure 5.
Figure 5: Mean values of Double-Stranded DNA (dsDNA) Levels with 95% confidence intervals by groups of the study Showing the P-value of the two independent t-test comparisons.
Complement components c3 and c4 levels
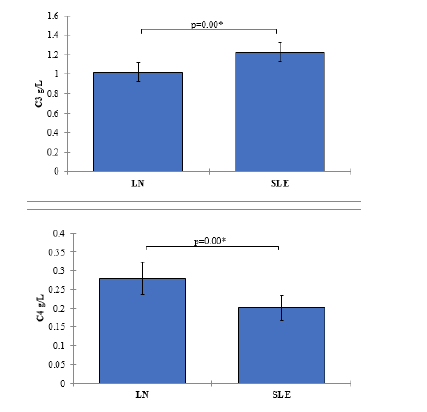
In the LN group, the mean C3 level was 1.03 g/L (SD=0.38), and the mean C4 level was 0.28 g/L (SD=0.17). In the SLE group, the mean C3 level was 1.23 g/L (SD=0.38), and the mean C4 level was 0.20 g/L (SD=0.13). The comparisons of C3 and C4 levels between the LN and SLE groups resulted in p-values of 0.004, indicating statistically significant differences. SLE patients with nephritis exhibited significantly higher C3 levels and lower C4 levels compared to those without nephritis (Figure 6).
Figure 6: Mean values of Complement Components C3 and C4 Levels with 95% confidence intervals by groups of the study Showing P-value of the two independent t-test comparisons
Correlation analysis
Systemic Lupus Erythematosus (SLE) patients:
Table 4 presents the correlation matrix for various variables in the group of Systemic Lupus Erythematosus patients which provides insights into the relationships between CYS-C ng/mL, and various clinical and laboratory parameters in SLE patients. These findings contribute to our understanding of the potential associations and interactions between these variables in the context of SLE. The table includes the correlation coefficients between the variables CYS-C ng/mL as well as their correlations with other variables.
Tab. 4. Correlation matrix (Pearson) / Group SLE
| Variables | CYS-C ng/mL |
|---|---|
| Age | -0.06 |
| BMI kg/m2 | -0.08 |
| CYS-C ng/mL | 1 |
| ANA IU/mL | 0.05 |
| dsDNA U/mL | 0.29 |
| C3 g/L | 0.13 |
| C4 g/L | 0.05 |
In Table 4, it can be observed that CYS-C ng/mL has a weak negative correlation with age and body mass index, suggesting that as age and BMI increase, the levels of CYS-C decrease slightly.
The variables CYS-C ng/mL show a weak positive correlation with dsDNA U/mL. These correlations suggest a potential association between elevated levels of CYS-C and immune activity (dsDNA).
the significance of correlations is indicated by the bolded values in the table. The correlations with bolded values significantly differ from 0 at a significance level (alpha) of 0.05, suggesting a stronger relationship between those variables.
Systemic Lupus Erythematosus with nephritis (LN) group
Table 5 presents the correlation matrix for various variables in the group of Systemic Lupus Erythematosus with clinically evident nephritis (LN) patients. The table includes the correlation coefficients between the variables CYS-C ng/mL as with other variables. it can be observed that CYS-C ng/mL has a moderate positive correlation with each other.
Tab. 5. Correlation matrix (Pearson) / Group LN
| Variables | CYS-C ng/mL |
|---|---|
| Age | 0.16 |
| BMI kg/m2 | 0.1 |
| CYS-C ng/mL | 1 |
| ANA IU/mL | 0.19 |
| dsDNA U/mL | -0.05 |
| C3 g/L | 0.22 |
| C4 g/L | 0.22 |
The variables CYS-C ng/mL show weak positive correlations with age and BMI kg/m2, indicating that higher levels of CYS-C are slightly associated with older age and higher body mass index.
Furthermore, the correlation coefficients between CYS-C ng/ mL with other variables in the LN group are generally weak,with some exceptions. There is a moderate positive correlation between CYS-C and C3 g/L. the significance of correlations is indicated by the bolded values in the table. The correlations with bolded values significantly differ from 0 at a significance level (alpha) of 0.05, suggesting a stronger relationship between those variables.
ROC analysis
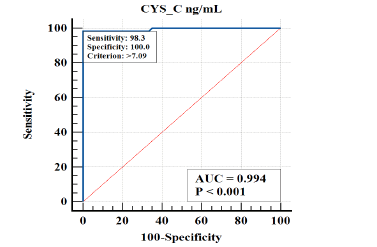
The diagnostic performance of CYS-C in distinguishing between Systemic Lupus Erythematosus with clinically evident nephritis patients from Systemic Lupus Erythematosus patients without nephritis was assessed. The results are summarized in Table 6 and Figure 7.
Tab. 6. Diagnostic Performance Measures for CYS-C
| Variable | AUC | SE | 95% CI | Cutoffs | Sensitivity | Specificity | +LR | -L |
|---|---|---|---|---|---|---|---|---|
| CYS_C | 0.99 | 0.0058 | 0.95 to 1.00 | >7.09 | 98.33 | 100 | 0.02 |
Figure 7: ROC curve showing diagnostic performance for CYS-C in predicting Systemic Lupus Erythematosus with clinically evident nephritis patients from Systemic Lupus Erythematosus patients without nephritis
CYS-C
For CYS-C, the Area Under the Curve (AUC) was found to be 0.994, indicating a high discriminatory power of this variable in accurately distinguishing the condition. The 95% confidence interval (CI) for the AUC ranged from 0.95 to 1.00, suggesting a high level of precision in the estimated AUC. The cutoff value for CYS-C was set at >7.09, which can be used as a threshold to identify individuals with the condition. Furthermore, CYS-C exhibited a sensitivity of 98.33%, implying that it correctly identified 98.33% of individuals with the condition. Moreover, the specificity of CYS-C was determined to be 100%, indicating its ability to accurately identify all individuals without the condition (Figure 7).
Discussion
In this study, we evaluated the levels of serum Cystatin C (CYS-C) in patients with Systemic Lupus Erythematosus (SLE) with and without clinically evident nephritis. The aim was to assess the potential of this biomarker as a diagnostic indicator and to compare our findings with the existing literature.
Age and BMI
Our results showed significant differences in the levels of various biomarkers between the SLE group and the control group (LN) without SLE. When comparing the demographic characteristics, such as age and Body Mass Index (BMI), no significant differences were observed between the two groups. This suggests that the studied biomarkers may have a direct association with the disease rather than being influenced by age or BMI [4, 5].
In which they found Patients diagnosed during adolescence exhibit greater disease activity and “classic” autoantibody, immune cell, and complement patterns when compared with younger patients [6].
Immunological parameters
Antinuclear Antibodies (ANA IU/mL) and double-stranded DNA (dsDNA U/mL):
The analysis of immune-related biomarkers revealed substantial differences between the SLE group and the LN group. SLE patients had significantly lower levels of antinuclear antibodies (ANA IU/mL) and double-stranded DNA (dsDNA U/mL) compared to the LN group. The reason for the high level of ANA is that the immune system produces antibodies to body proteins that bind to the contents of the cell nucleus, the body generates an immune response against itself (autoimmune disorder) and the body generates an excessive immune response to the stranger antigens and damages normal body tissues (allergic reaction) [7, 8].
Recent studies reported that ds-DNA is considered a principal autoantigen in the case of SLE on the basis of positive effects and significant pathogen functions. Furthermore, dsDNA antibodies can be identified a s a s ensitive m arker i n p atients w ith r enal disorders [9, 10].
Conversely, other studies have shown that many patients with anti-dsDNA never develop LN and some patients with LN do not have anti-dsDNA [11, 12].
Complement Components C3 and C4 Levels:
The comparisons of C3 and C4 levels between the LN and SLE groups resulted in p-values of 0.004, indicating statistically significant differences. SLE patients with nephritis exhibited significantly higher C3 levels and lower C4 levels compared to those without nephritis.
The complement system is a complex i mmune system pathway collected from proteins and receptors that improve the ability of an organism's antibodies and phagocytes to remove microorganisms and injured cells. Moreover, it acting an essential function in the inflammatory response in many autoimmune syndromes, including SLE, as well as its role in fighting infective disorders
he results of this study agree with the literature [13, 14]. where C3 levels decreased in the case of SLE disease and its complications such as LN, which is attributed to the development of protein complementary pathways [15].
Cystatin C (CYS-C) Levels:
CYS-C demonstrated excellent diagnostic accuracy, with an AUC of 0.994. The optimal cut-off va lue for CY S-C (>7.09 ng/mL) yielded high sensitivity (98.33%) and perfect specificity (100%) in identifying SLE patients with clinically evident nephritis. These findings indicate that CYS-C can serve as a reliable biomarker for the diagnosis of nephritis in SLE patients.
Cystatin C elevated nephritis due to a reduction in the glomerular filtration rate leads to a decrease in the excretion of cystatin C in urine and this lead to an increase in blood in patients. Cys C, independent of renal function, was considered an inflammatory marker.
Interestingly, our study also demonstrated a significant association between CYS-C levels and dsDNA levels in SLE patients. The positive correlation between CYS-C and dsDNA suggests a potential relationship between increased CYS-C levels and elevated dsDNA levels in SLE patients. This finding aligns with previous studies that have reported the involvement of CYS-C in the pathogenesis of SLE and its association with disease activity [16, 17]
In summary, our study highlights the potential of CYS-C as a diagnostic biomarker for nephritis in SLE patients. This biomarker demonstrated excellent diagnostic accuracy and showed significant associations with other immune-related parameters. The findings contribute to the existing literature on SLE and provide insights into the pathogenesis and clinical implications of nephritis in SLE.
However, it is important to acknowledge some limitations of our study. Firstly, the sample size was relatively small, and further studies with larger cohorts are recommended to validate our findings. Secondly, our study focused on a specific population, and the results may not be generalizable to other ethnic groups or geographical locations. In conclusion, the evaluation of serum CYS-C levels in SLE patients with and without clinically evident nephritis revealed significant associations with immune-related parameters and demonstrated excellent diagnostic accuracy. These findings contribute to our understanding of the pathogenesis of SLE and provide potential biomarkers for the diagnosis and management of nephritis. Further research is needed to elucidate the underlying mechanisms and to explore the clinical utility of these biomarkers in larger and more diverse populations.
Conclusion
Levels of Cystatin-C are regarded as reliable indicators of renal damage in the case of Lupus condition. Accordingly, to the Receiver Operating Characteristic (ROC) which was used as an indicator of Lupus Nephritis, there was a significant increase in serum Cystatin-C. Cystatin-C is a good factor for diagnosing Lupus Nephritis patients more than SLE patients without renal involvement.
References
- Lazar S, Kahlenberg JM. Systemic lupus erythematosus: new diagnostic and therapeutic approaches. Ann Rev Med. 2023;74:339-352.
[Google Scholar] [ Crossref]
- Irure-Ventura J, López-Hoyos M. Disease criteria of systemic lupus erythematosus (SLE); the potential role of non-criteria autoantibodies. J Transl Autoimmun. 2022;5:100143.[ Google Scholar] [ Crossref]
- Kar S, Paglialunga S, Islam R. Cystatin C is a more reliable biomarker for determining eGFR to support drug development studies. J Clin Pharmacol. 2018;58:1239-1247.
[Google Scholar] [ Crossref]
- Hamid SKA, ELshazly A, Abd Elmawgood Faisal Y, Aly MM. Renal Arterial Resistive Index as a Prognostic Marker in Lupus Nephritis Patients. Nefrología. 2023.
- Liu J, Song W, Cui D. Relationship between blood lipid profiles and risk of lupus nephritis in children. Int J Clin Pract. 2022.[ Google Scholar]
- Massias J, Smith E, Al-Abadi E, Armon K, Bailey K,et al. Clinical and laboratory characteristics in juvenile-onset systemic lupus erythematosus across age groups. Lupus. 2020;29:474-481.
- Kudose S, Santoriello D, Bomback AS, Stokes MB, D’Agati VD,et al. Sensitivity and specificity of pathologic findings to diagnose lupus nephritis. Clin J Am Soc Nephrol. 2019;14:1605.[ Google Scholar]
- Hemdan AM, Alsayed SAE. Correlation between activity of lupus nephritis and different ANA antibodies. Sohag Med J. 2021;25:68-77.
- Kianmehr N, Khoshmirsafa M, Shekarabi M, Falak R, Haghighi A, et al.High frequency of concurrent anti-C1q and anti-dsDNA but not anti-C3b antibodies in patients with Lupus Nephritis. J Immunoassay Immunochem. 2021;42:406-423.
- Huang Y-J, Lin C-H, Yang H-Y, Luo S-F, Kuo C-F. Urine Soluble CD163 Is a Promising Biomarker for the Diagnosis and Evaluation of Lupus Nephritis. Front Immunol. 2022;13:935700.[ Google Scholar]
[Crossref]
- Ashraf A, Daloya J, Rana V, Ahmed A, Kaell Aet al. Diagnosing and Managing Clinically Silent Lupus Nephritis and Anti-neutrophil Cytoplasmic Antibody-Associated Vasculitis Overlap Syndrome: A Clinical Challenge. Cureus. 2022;14.
- Moroni G, Radice A, Giammarresi G, Quaglini S, Gallelli B,et al. Are laboratory tests useful for monitoring the activity of lupus nephritis? A 6-year prospective study in a cohort of 228 patients with lupus nephritis. Ann Rheum Dis. 2009;68:234-237.
[Google Scholar] [ Crossref]
- Farid A, Abd Almolaa T, Safwat G. Complements as a predictive biomarker of lupus nephritis in female patients with systemic lupus erythematosus. Int J Cancer Biomed Res. 2020;4:201-207.
- Ligtenberg G, Arends S, Stegeman CA, de Leeuw K. Predictors of renal flares and long-term renal outcome in patients with lupus nephritis: Results from daily clinical practice. Clin Exp Rheumatol. 2021;40:33-38.
- Radanova M, Vasilev V, Dimitrov T, Deliyska B, Ikonomov V, et al.Association of rs172378 C1q gene cluster polymorphism with lupus nephritis in Bulgarian patients. Lupus. 2015;24:280-289.
- Baraka E, Hashaad N, Abdelhalim W, Elolemy G. Serum cystatin C and βeta-2 microglobulin as potential biomarkers in children with lupus nephritis. Arch Rheumatol. 2023;38:56.[ Google Scholar]
- Tony E, Mohammed H, Fathi N, Tony A, Afifi O, et al.Serum and urinary biomarkers endothelin-1, beta-2 microglobulin, cystatin C, galectin-3 and alpha-1-acid glycoprotein; can they surrogate clinical and histological staging in lupus nephritis patients. J Arthritis. 2016;5.
