Research Article - Onkologia i Radioterapia ( 2022) Volume 16, Issue 1
Evaluating the performance of two matched elekta versa HD machines for agility MLC modeling in VMAT plans using the monaco treatment planning system
Ibrahim H. Alnidawi1*, Mohamed N. Yaseen2, Magdy M. Khalil2 and Hany M. Ammar3,42Department of Physics, Faculty of Science, Helwan University, Egypt
3Department of Cancer, Children’s Cancer Hospital, Egypt
4Department of Medicine, Aswan University, Aswan, Egypt
Ibrahim H. Alnidawi, Departmment of Iraqi Ministry of Health, Baghdad Center for Radiotherapy and Nuclear Medicine, Baghdad, Iraq, Email: ahmedsalihdr2008@yahoo.com
Received: 11-Dec-2021, Manuscript No. M- 49543; Accepted: 31-Dec-2021, Pre QC No. P-49543; Editor assigned: 13-Dec-2021, Pre QC No. P-49543; Reviewed: 23-Dec-2021, QC No. Q-49543; Revised: 31-Dec-2021, Manuscript No. R-49543; Published: 07-Jan-2022
Abstract
The aim of this study was to investigate the accuracy and tolerance of using a single data set to perform agility head Multi-Leaf Collimator (MLC) modelling in Volumetric Modulated Arc Therapy (VMAT) plans using two matched linear accelerators. First, the Express QA package provided by the system manufacturer was measured on two matched Versa HD Linear Accelerators (LINACs) at to evaluate the match credibility for the MLC parameters of the two LINACs assessed. Second, ten patients with head and neck cancer and ten patients with prostate cancer were evaluated, with and without MLC modelling, while maintaining identical optimisation constraints in the VMAT plans. All patient plans were verified using an IBA Dosimetry MatriXXEvolution array inserted into a multi cube phantom. Finally, ten head and neck clinical cases were measured using the MatriXX array on the two matched LINACs. Comparisons were performed using IBA MyQA patient software, including a gamma index and profile-to-profile analysis. During the first evaluation, 3ABUT plan analysis was performed at the first abutting line y1 and the second abutting line y2, which showed significant gamma index differences for the minor offsets between the two LINACs. In FOURL, the gamma index analysis results showed some differences for leaf groove and abutting regions. The abutting region showed a high level of gamma index agreement, whereas the tongue and groove region showed obvious gamma index discrepancies. For the second evaluation, in patients with head and neck and prostate cancers, the differences in the Planned Targeting Volume (PTV) doses were not significant, and most variations were associated with the maximum dose. Although the identified discrepancies were not significant, even small differences could be clinically crucial for accurate and precise radiation treatment planning. During the final assessment, the evaluations of the two matched Versa HD LINACs were compared to investigate their impacts on treatment plans for patients using the VMAT technique. The reference LINAC showed high agreement with the calculated dose, although some variations were reported when compared with the other LINAC. The deviations, in some cases, were greater than 4% for the VMAT plans, with 2% mean differences for all plans. The discrepancies between clinical cases were likely due to one or more MLC parameters differing between the two LINACs. Performing VMAT plans may have increased the chances of these differences appearing. The use of a single set of MLC parameters might not be an optimal approach for matched LINACs. The MLC parameters showed significant discrepancies between the two matched LINACs and should potentially be considered in the matching adjustment.
Keywords
VMAT, MLC, express QA package, elekta versa HD, monaco TPS
Introduction
Volumetric Modulated Arc Therapy (VMAT) offers equivalent or higher levels of conformity to target volumes and faster delivery times than step and shoot or dynamic Intensity- Modulated Radiotherapy (IMRT) methods. VMAT can, therefore, deliver a conformal prescription dose to the target volume while minimising the dose delivered to normal tissues. VMAT is a system for IMRT treatment delivery that achieves high dose conformity by optimising the dose rate, gantry speed, and leaf positions of the dynamic Multileaf Collimator (MLC). The delivery of VMAT is inherently more complex than the delivery of fixed gantry IMRT [1, 2].
The Versa HD is a digital Linear Accelerator (LINAC) that is capable of delivering photon beams at 6 MV, 6 MV Flattening Filter-Free (FFF), 10 MV, 10 MV FFF, and 18 MV and electron beams at 4 MeV, 6 MeV, 8 MeV, 9 MeV, 12 MeV, and 15 MeV. The maximum field size is (40 × 40) cm2, which is defined by a pair of sculpted diaphragms mounted orthogonal to the MLC. The MLCs replace the jaws that are normally positioned in the orthogonal direction, and no backup jaws or diaphragms are used. The 80‐pair, interdigitating MLCs have a projected leaf width of 5 mm at the isocenters of all leaves. The tungsten MLCs in the Agility collimator (Elekta, Stockholm, Sweden) are 9 cm thick and have a leaf speed of 3.5 cm/s. The carriage can travel up to 3 cm/s, providing a maximum MLC speed of 6.5 cm/s [3, 4].
The verification of radiotherapy treatment plans is a critical step when applying complex radiotherapy techniques [5]. The Two-Dimensional (2D) ionisation chamber array MatriXX Evolution was developed by IBA Dosimetry (IBA Dosimetry, Germany) for the megavoltage, real-time, absolute 2D dosimetry and verification of IMRT and VMAT plans and has been characterised for sub-megavoltage-range beam dose verification and quality assurance applications [6].
Materials and Methods
The Express QA consists of eight QA plans. Two of the eights plans are open fields, 10 cm2 × 10 cm2, that consist of the following: MLC, 10 cm2 × 10 cm2 field; Jaw, 20 cm2 × 20 cm2 field; 3ABUT, three 6 cm × 24 cm abutted segments; 7aegA, 7 segments with 2 cm × 24 cm beams; FOURL, 4 "L" MLC Segments, with Jaw 20 cm2 × 20 cm2; Dynamic MLC 1 (DMLC1), Jaw 20 cm2 × 20 cm2; MLC, 2 × 20,-10>+10; highdefinition MLC (HDMLC) beam A, 33 segments; HN DMLC beam and HIMRT A, 33 segments HN IMRT beam.
Two of the eight plans are open fields (10 cm2 × 10 cm2 and 20 cm2 × 20 cm2) used to verify the absolute dose calibration, the flatness, and the symmetry. The 3ABUT plan was used to evaluate the MLC major offset, consisting of three-abutted 6 cm2 × 24 cm2 beam segments. The four L plan was used to evaluate the ‘FOURL’ field configured using four abutted L-shaped segments, which can be used to evaluate MLC offset, leaf groove, and MLC transmission.
The ‘7SegA’ plan is a picket-fence type of beam that was used to evaluate the MLC in that region, in terms of both major and minor MLC offsets, The DMLC1 beam is a 2.0 cm × 20.0 cm (2.0 cm × 16.0 cm for the BM accelerator) type of MLC aperture, sweeping from -10 cm to +10 cm, with fixed the jaws at 20 cm × 20 cm. The gantry and collimator angles were set to 0, which was used to evaluate the major and minor offsets of the MLC leaves.
HDMLC consists of a 33-segment head and neck (H&N) DMLC beam that was used to evaluate the DMLC performance. HIMRT consists of 33 segments of H&N IMRT beams, used to evaluate the IMRT plan performance. All plans were measured on two Versa HD LINAC matched machines, using a 2D ion chamber array (IBA MatriXX) housed in a multi-cube phantom. The MLC modelling parameters were evaluated on both LINACs to determine any differences and examine whether this package can be used on two LINACs or should be limited to one LINAC.
The VMAT technique on the Monaco Treatment Planning System (TPS) was evaluated in 10 H&N cancer cases and 10 prostate cancer cases who had their treatment at Children’s Cancer Hospital Egypt (57357 Hospital), first using the old machine without modelling and second using the new machine with MLC modelling while maintaining the same constraints. Data was collected using dose-volume histograms various parameter, such as Planned Targeting Volume (PTV) and critical organs, to evaluate the dosimetric effects of MLC modelling.
Results
3ABUT
The results of the 3ABUT plan were measured for the reference LINAC and compared against the calculated plan using the default model on the TPS, which showed no offset adjustments were required. (Figure 1) shows the 3ABUT measurementnormalised offset gamma analyses for the two LINACs, which were calibrated to deliver the same absolute dose and dose rate. Additional analyses revealed that the first abutting line, y1, and the second abutting line, y2, showed significant gamma index differences for the minor offsets between the two LINACs, as shown in (Figures 2 and 3).
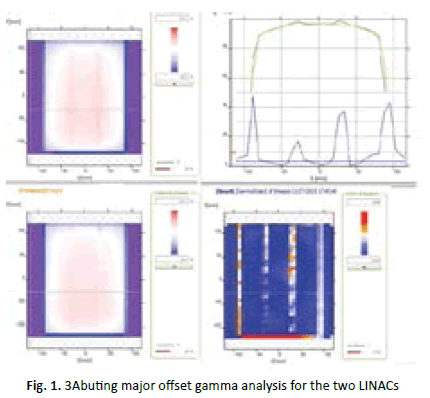
Figure 1: 3Abuting major offset gamma analysis for the two LINACs
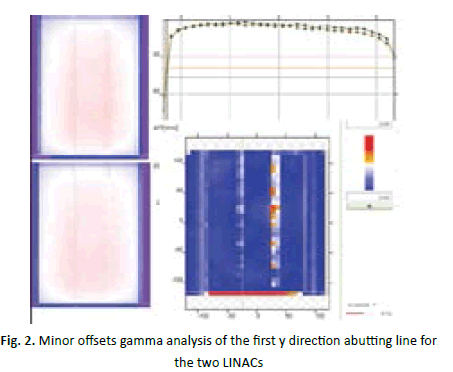
Figure 2: Minor offsets gamma analysis of the first y direction abutting line for the two LINACs
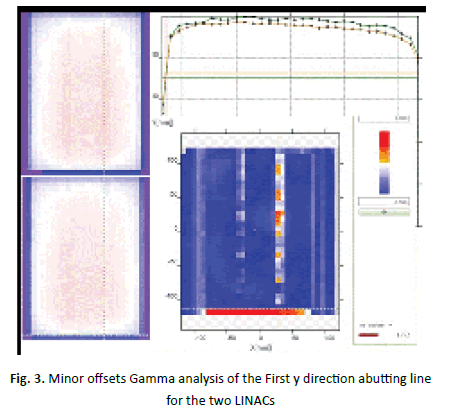
Figure 3: Minor offsets Gamma analysis of the First y direction abutting line for the two LINACs
FOURLFigure 4 shows a comparison of various regions of the FOURL shape between the two LINACs, which was used to analyse the MLC offset, leaf groove, and MLC transmission. The abutting region showed high gamma index agreement, whereas the tongue and groove region showed clear gamma index discrepancies, which are represented by the blue curve in (Figure 5).
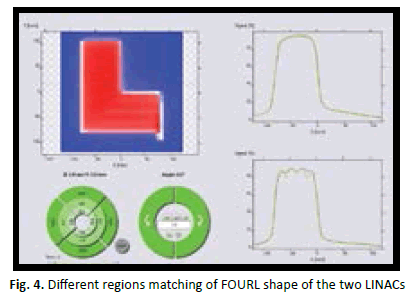
Figure 4: Different regions matching of FOURL shape of the two LINACs
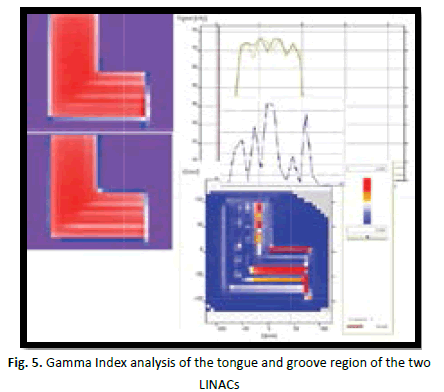
Figure 5: Gamma Index analysis of the tongue and groove region of the two LINACs
7SegA
Figure 6 shows the gamma index comparison between the matched LINACS, which emphasises the existence of MLC offset differences between the two LINACs, as indicated by the blue gamma index curve with a maximum value greater than 1.4. The gamma index curve ranges in value between 0-2, with 0 indicating a passing value and 2 indicating failure. Some points of the merit curves are shown in Figure 6 colour and isodose.

Figure 6: Gamma Index analysis of 7segA shape for the two LINACs
Clinical plans before and after MLC modelling
To assess the value of MLC modelling and examine the effects of MLC modelling on TPS calculations in cases using the VMAT technique, 10 patients with H&N cancer and 10 patients with prostate cancer were evaluated with and without MLC modelling while maintaining the identical optimisation constraints in the VMAT plans. The dose statistics were extracted using dosevolume histogram for PTV and critical organs. (Figures 9 and 10) shows the differences between the PTV and critical organ doses for the 20 cases before and after modelling. This test was performed by the Monaco TPS, and (Figures 7 and 8) show the dose distribution and the dose-volume histogram comparisons for H&N and prostate cancer patients, demonstrating the variations before and after MLC modelling.
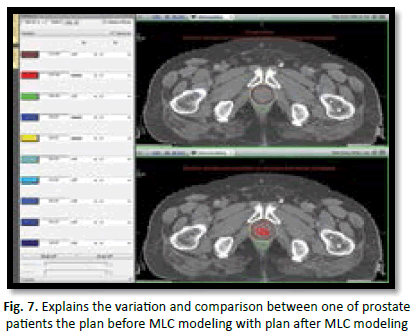
Figure 7: Explains the variation and comparison between one of prostate patients the plan before MLC modeling with plan after MLC modeling
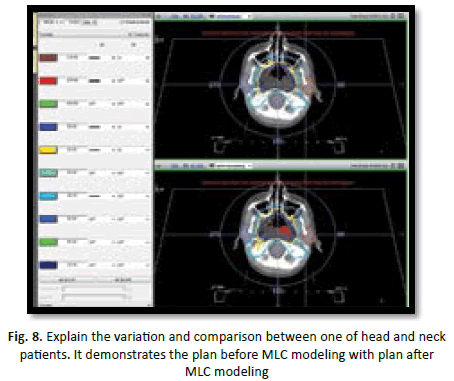
Figure 8: Explain the variation and comparison between one of head and neck patients. It demonstrates the plan before MLC modeling with plan after MLC modeling
In prostate cancer patients, the mean coverage volume for 95% of the PTV dose was 7,759.9 ± 174.77 cGy, ranging from 7,529-7,980 cGy before modelling. After modelling, the mean coverage volume for 95% of the PTV dose was 7,759.86 ± 153.3 cGy, ranging from 7,526.7-7,980 cGy. In prostate cancer patients, the mean coverage volume for 50% of the rectum was 4,270.75 ± 745.7 cGy, ranging from 2,863.2-5,552.9 cGy before modelling. After modelling, the mean coverage volume for 50% of the rectum became 4,302.05 ± 736.9 cGy, ranging from 2,936.1-5,528 cGy. In addition, the mean coverage volume for 50% of the bladder was 3,404.89 ± 996.9 cGy, ranging from 1,518.4-4,937 cGy before modelling. After modelling, the mean coverage volume for 50% of the bladder became 3,448.4 ± 970.9 cGy, ranging from 1,539.2-4,989.7 cGy. In prostate cancer patients, the mean coverage volume of the maximum PTV dose was 8,878.29 ± 214.4 cGy, ranging from 8,475.3-9,192.5 cGy before modelling. After modelling, the mean coverage volume of the maximum PTV dose became 8,853.85 ± 242.6 cGy, ranging from 8,462.9-9163.5 cGy (Figure 9).
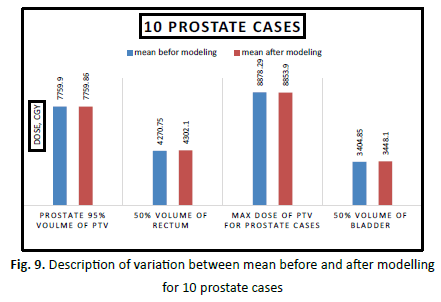
Figure 9: Description of variation between mean before and after modelling for 10 prostate cases
In H&N cancer patients, the mean coverage volume for 95% of the PTV dose was 5,824.94 ± 176.1 cGy, ranging from 5,508- 6,089.6 cGy before modelling. After modelling, the mean coverage volume for 95% of the PTV dose became 5,870 ± 158.6 cGy, ranging from 5,588.8-6,115.7 cGy. Also, the mean coverage volume of the maximum dose for the spinal cord was 528.77 ± 131.7 cGy, ranging from 4,332.4-4,747.2 cGy before modelling. After modelling, the mean coverage volume of the maximum dose for the spinal cord became 4,556.42 ± 191.8, ranging from 4,300.9-4,886.7 cGy. In H&N cancer patients, the mean coverage volume of the maximum dose for the brainstem was 5,409.46 ± 104.8 cGy, ranging from 5,251.1-5,526.5 cGy before modelling. After modelling, the mean coverage volume of the maximum dose for the brainstem became 5,401.85 ± 123.7 cGy, ranging from 5,183.6-5,583.7 cGy. In addition, the mean coverage volume of the maximum PTV dose was 6,795.57 ± 92.9 cGy, ranging from 6,703.3-6,958 cGy before modelling. After modelling, the mean coverage volume of the maximum PTV dose became 6,823.64 ± 83.9 cGy, ranging from 6,700- 6.956.2 cGy (Figure 10).
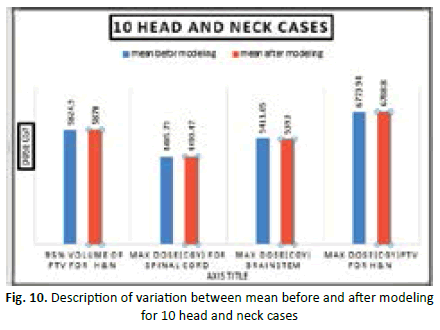
Figure 10: Description of variation between mean before and after modeling for 10 head and neck cases
Clinical practice evaluation of differences in levels between the two machines
The ten H&N VMAT plans were sequentially measured using the QA function on both matched machines, after adjusting the reference calibration dose parameter values for both LINACs, as shown in (Table 1).
| Patient No | linac1 with calculated dose | LINAC 2 with calculated dose |
|---|---|---|
| P 1 | 98.10% | 94% |
| P 2 | 96.50% | 95.10% |
| P 3 | 97.50% | 95% |
| P 4 | 95.20% | 94% |
| P 5 | 95.70% | 94% |
| P 6 | 98.30% | 97.50% |
| P 7 | 98.70% | 97% |
| P 8 | 96.50% | 95% |
| P 9 | 97.50% | 96.50% |
| P 10 | 98% | 97.10% |
Tab.1. Display the result of measuring ten plans on two Versa HD machines to evaluation the matching of two Versa HD machines
Discussion
Evaluation of the express QA package
The Express QA plans for MLC modelling were provided by the vender and measured on one of our VERSA HD machines using the IBA Dosimetry MatriXXEvolution array, hosted in a multi cube phantom. The dose distributions of the measured Express QA plans were sent to the vendor in CVs format. Files with the new MLC parameters were received from the vendor in XML format. The new MLC parameters, such as tongue and groove, leaf offset, and MLC transmission were input into the Monaco TPS to achieve accurate dose calculations for the VMAT plans, calculated using the Monte Carlo algorithm. The Express QA package was evaluated by measuring all Express QA package parameters on two matched Versa HD machines, examining any differences. The goal was to determine whether a single set of MLC modelling parameters, calculated based on the parameters for one machine, could be implemented effectively on both machines. Although, the values received from the vendor for modelling the MLC transmission was slightly different from the default values, significant clinical differences were identified for the examined cases before and after the implementation of MLC modelling, as described in the results.
Table 2 showed that the lowest level of matching was observed for FOURL plans, with the lowest observed value of 89.6%; in contrast, greater than 95% matching was observed for the rest plans.
| ID | Description | LINAC1 with LINAC2 Gamma index 3%/3mm | LINAC1 with LINAC2 Gamma index 2%/2mm |
|---|---|---|---|
| 1 | 3ABUT | 95.20% | 86.20% |
| 2 | HIMRT | 96.40% | 89.90% |
| 3 | FOURL | 89.60% | 83.60% |
| 4 | DMLC1 | 97.80% | 85.40% |
| 5 | HDMLC | 95.50% | 86.60% |
Tab.2. Description of measuring Express QA package on machine1 and machine 2
This finding was supported by the gamma analysis results, shown in Figures 1-7, especially those for the 3ABUT and FOURL plans. Despite the recommendation of the vendor that the same set of model MLC parameters could be implemented in the two matched machines, some MLC behaviour discrepancies were observed. In agreement with the importance of performing Express QA analysis for MLC modelling, a limited number of publications have previously mentioned this issue, such as the study performed by Snyder, et al. (2016) [7]. These authors investigated the relationships between the various parameters of the Monaco MLC model and the dose calculation accuracies determined for an Elekta agility MLC. They also stated that the MLC model in Monaco is firm and can be tuned extensively to produce accurately calculated dose distributions. However, the number of tunable parameters potentially allows for the over-modelling of the MLC, and in its current form, the model adjustment can be limited to changing the leaf offset, leaf tip leakage, and leaf transmission parameters to obtain a good result. In our study, we highly agree with the recommendations of the previous study, which concluded that the vendor provided Express QA package is very useful for verifying the reasonability of the model at MLC segment match lines; however, pointbased dose measurements and planar QA for several different simulated clinical plans appear to be necessary to guarantee a clinically accurate model.
Evaluation of MLC modelling on the Monaco TPS
As shown in Table 3, most of the calculated p-value indicated non-significant differences; however, even slight discrepancies can be clinically crucial when attempting to provide accurate and precise radiation treatments to cancer patients.
| Items | mean before modeling | mean after modeling | P value |
|---|---|---|---|
| Prostate 95% volume of PTV | 7759.9 ± 174.77 | 7759.86 ± 153.3 | 0.58 |
| 50% volume of rectum | 4270.75 ± 745.7 | 4302.1 ± 736.94 | 0.99 |
| Max dose of PTV for Prostate cases | 8878.29 ± 214.47 | 8853.9 ± 242.65 | 0.0028 |
| 50% volume of bladder | 3404.85 ± 996.94 | 3448.1 ± 970.91 | 0.516 |
| 95% volume of PTV for H&N | 5824.94 ± 176.1 | 5870 ± 158.6 | 0.18 |
| Max dose (cGy) for spinal cord | 4485.73 ± 119.24 | 4499.47 ± 163.49 | 0.017 |
| Max dose (cGy) brain stem | 5411.05 ± 102 | 5393 ± 120.02 | 0.072 |
| max dose (cGy) PTV for H&N | 6773.94 ± 118.74 | 6788.8 ± 120.04 | 0.092 |
Tab.3. The mean value for different organs before and after MLC modeling and show the value of T test
Radiotherapy technology continues to advance, and the expectation of improved outcomes requires increased accuracy during various radiotherapy steps. Defining the origins of uncertainty during the delivery of radiotherapy is necessary to promote the delivery of safe doses to patients and to ensure the accuracy of radiation treatments.
Evaluation of matching between the two Versa HD machines
The matching between the two matched Versa HD LINACs was evaluated based on attempts to treat patients using the VMAT technique. Ten H&N patient treatment plans were measured sequentially on the same day using the reference LINAC, by using multi cube phantom and 2D array chambers. The same plans were then measured on the matched LINAC, using the same parameters, after normalising the calibration parameters between the two LINACs. The data were analysed using QA patient software, with the gamma index parameter set to 3%/3 mm search distance. The reference LINAC showed high agreement with the calculated dose; however, some variations were reported when compared against the matched LINAC. For the direct match before commissioning the MLC parameters, the deviation was adjusted to than 1% between the two LINACs. In the blue table, the deviations in some cases were greater than 4% for VMAT plans, even though the mean difference for all plans was 2%.
Conclusion
A single data set of MLC agility parameters was successfully modelled in the Monaco TPS for one Versa HD LINAC and was evaluated in the matched LINAC using the Express QA package. However, using a single set of MLC parameters for both matched LINACs resulted in a clinically significant deviation between the two systems during the execution of VMAT plans. This finding might lead to the loss of privilege for sweeping patients between matched LINACs without first making modifications. Additional investigations are necessary to maintain the privilege of utilising matched LINACs for the application of VMAT plans without affecting the quality and efficiency of radiation treatment plans. Special considerations should be taken for MLC parameters when accepting and commissioning the use of matched LINACs, and additional verification procedures should be established during scheduled quality assurance programs used to evaluate the LINACs.
To achieve and maintain a high matching level between matched LINACs, the use of the Express QA package is recommended. Express QA evaluations should be involved in the acceptance testing procedures used for matched Elekta LINACs before commissioning and modelling the MLC parameters into the Monaco TPS.
References
- Zwan BJ, Barnes MP, Fuangrod T, Stanton CJ, O'Connor DJ,et al. An EPID‐based system for gantry‐resolved MLC quality assurance for VMAT. J Appl Clin Med Phys. 2016;17:348-365.
- LoSasso T, Chui CS, Ling CC. Comprehensive quality assurance for the delivery of intensity modulated radiotherapy with a multileaf collimator used in the dynamic mode. Medi Phy. 2001;28:2209-2219.
- Vanetti E, Clivio A, Nicolini G, Fogliata A, Ghosh-Laskar S, et al. Volumetric modulated arc radiotherapy for carcinomas of the oro-pharynx, hypo-pharynx and larynx: a treatment planning comparison with fixed field IMRT. Radiother Oncol. 2009;92:111-117.
- Narayanasamy G, Saenz D, Cruz W, Ha CS, Papanikolaou N,et al. Commissioning an Elekta Versa HD linear accelerator. J Appl Clin Med Phys. 2016;17:179-191.
- Siebers JV, Keall PJ, Arnfield M, Kim JO, Mohan R. Dynamic-MLC modeling for Monte Carlo dose calculations. Springer. 2000;15:455-457.
Google Scholar Cross Ref
- Varadharajan E, Ramasubramanian V. Commissioning and Acceptance Testing of the existing linear accelerator upgraded to volumetric modulated arc therapy. Reports Practical Oncol Radiother. 2013;18:286-297.
- Snyder M, Halford R, Knill C, Adams JN, Bossenberger T,et al. Modeling the Agility MLC in the Monaco treatment planning system. J Appl Clin Med Phys. 2016;17:190-202.


