Review Article - Onkologia i Radioterapia ( 2026) Volume 20, Issue 7
Establishing Locally Derived Gamma Passing-Rate Tolerance Limits for Patient-Specific VMAT Quality Assurance: A Retrospective ROC-Based Analysis in a Moroccan Radiotherapy Center
Adil El Badaoui* and Mourad TrihiAdil El Badaoui, Department of Physics, Faculty of Sciences Aïn Chock (FSAC), Hassan II University of Casablanca, Morocco, Email: adilelbadaoui44@gmail.com
Received: 01-Jul-2026, Manuscript No. OAR-26-193213; , Pre QC No. OAR-26-193213 (PQ); Editor assigned: 03-Jul-2026, Pre QC No. OAR-26-193213 (PQ); Reviewed: 18-Jul-2026, QC No. OAR-26-193213; Revised: 23-Jul-2026, Manuscript No. OAR-26-193213 (R); Published: 30-Jul-2026
Abstract
Background and purpose: Gamma-index acceptance criteria for patient-specific volumetric-modulated arc therapy (VMAT) quality assurance (QA) are largely inherited from Western cohorts, and North African centers routinely apply the AAPM Task Group 218 (TG-218) universal threshold without local validation. We derived and clinically validated institution-specific gamma passing-rate (GPR) tolerance limits for a Moroccan tertiary radiotherapy department. Materials and methods: One hundred fifty consecutive patient-specific VMAT plans (five anatomical sites; January 2022–December 2023) underwent pretreatment QA on an EPID-based system (iViewDose™, Elekta) and a cylindrical diode array (ArcCHECK™, Sun Nuclear) at 3%/3 mm, 3%/2 mm, and 2%/2 mm (global normalization, 10% dose threshold). GPR was correlated with threedimensional dose-volume histogram (DVH) deviations reconstructed from measurement (3DVH), specifically ΔD95 of the planning target volume (PTV) and ΔDmax of organs at risk (OAR). Receiver-operating-characteristic (ROC) curves, optimized by the Youden index and constrained to sensitivity ≥ 90% and specificity ≥ 85%, defined action and tolerance limits; Pearson correlations were reported with 95% confidence intervals (CI) obtained by Fisher z-transformation. Results: Mean ± SD GPR was 96.8 ± 2.4% (3%/3 mm), 94.2 ± 3.1% (3%/2 mm), and 89.3 ± 4.8% (2%/2 mm); all distributions were left-skewed (skewness, −1.3 to −2.1). ROC-optimized local limits were 95%/90% (action/tolerance) for 3%/3 mm, 92%/87% for 3%/2 mm, and 88%/82% for 2%/2 mm. GPR correlated inversely with ΔD95 PTV (r = −0.68; 95% CI, −0.76 to −0.58; P < .001; AUC = 0.84). A composite criterion (mean of 3%/2 mm and 2%/2 mm) achieved the best discrimination (AUC = 0.88; Youden J = 0.80) at 90%/85%. EPID readings were 1.2 percentage points (95% CI, 1.07–1.33) lower than ArcCHECK, without loss of diagnostic equivalence (AUC 0.83 vs 0.82; P = .71). Conclusion: Institution-specific thresholds were systematically stricter than the TG-218 universal recommendation and improved detection sensitivity for clinically significant errors from 82% to 94% at an acceptable 11% false-positive rate. This retrospective ROC-optimization framework is directly transferable to other resource-constrained radiotherapy centers seeking evidence-based, contextspecific QA tolerances.
Keywords
Patient-specific quality assurance; Volumetric-modulated arc therapy; Gamma index; ROC analysis; Tolerance and action limits; ArcCHECK; EPID dosimetry; Morocco
Introduction
Patient-specific quality assurance (QA) is the final technical checkpoint before a volumetric-modulated arc therapy (VMAT) plan is delivered to a patient, and its methods, failure modes, and evolving clinical role were recently surveyed in a comprehensive multi-society report [1]. The gamma index, formalized by Low et al. in 1998, remains the dominant metric for comparing measured and calculated dose distributions [2], combining a dose-difference (DD) and a distance-to-agreement (DTA) tolerance into a single pass/fail criterion. AAPM Task Group 218 (TG-218) codified 90% as the universal passing threshold for the 3%/3 mm criterion with global normalization and a 10% low-dose cutoff [3], building on the baseline confidence limits established a decade earlier by Task Group 119 [4]. Both reports were explicit that these values were starting points, not universal truths.
That caveat has been repeatedly confirmed. Per-beam planar passing rates correlate poorly with clinically relevant dose errors [5], and gamma performance itself is sensitive to the measurement device, TPS algorithm, and gamma-engine implementation [6, 7]. Several groups have therefore re-derived TG-218-style tolerance and action limits (TL/AL) locally, typically finding stricter values than the universal 90%: a Greek group used 3DVH reconstruction and ROC analysis in 173 head-and-neck and prostate VMAT plans 8; a Chinese cohort of 125 IMRT/VMAT patients found TL/AL more stringent than TG-218 across all six site-technique groups using SunCHECK [9]; and the same Greek group subsequently extended the approach from 2D to 3D %GP metrics, again reporting narrower institutional limits 10. Taken together, these reports point to the same conclusion: gamma tolerances depend on the measurement chain and clinical context rather than on a fixed universal constant. Yet almost all of this evidence still comes from North American, European, and East Asian centers.
Sub-Saharan and North African radiotherapy capacity, workforce, and equipment profiles differ substantially from those settings [11-14], and locally validated QA tolerances specific to the region remain essentially absent from the literature. Moroccan centers, including ours, have historically defaulted to unmodified TG-218 limits, a choice with real practical consequences. Our department, like many others in the region, operates a mixed fleet that includes earlier-generation Elekta and Varian linear accelerators without the latest-generation portal imagers, relies on a comparatively young and higher-turnover physics and dosimetry workforce, and faces machine-time constraints that shrink the practical window for re-planning a borderline QA result. Emerging artificial-intelligence tools for machine- and patient-specific QA [15] and recent Moroccan interest in AI-assisted radiotherapy planning [16] may eventually reduce this dependence on large retrospective measurement archives, but they still require a locally validated ground truth to train and audit against.
We therefore set out to derive and clinically validate gamma-index tolerance and action limits specific to a reference Moroccan VMAT program, using retrospective ROC analysis of 150 patient-specific QA measurements correlated with three-dimensional dose–volume histogram (DVH) deviations. A secondary aim was to package the analytical pipeline (measurement, 3D dose reconstruction, and ROC optimization) as a template that other centers in the region can reuse as their own QA archives mature.
Materials and Methods
Study design and plan sample
This retrospective single-center study included 150 consecutive patient-specific VMAT plans treated between January 2022 and December 2023, drawn from the institutional QA database. Eligibility required: (i) a pure VMAT technique (one to three full arcs); (ii) 6-MV photon energy; (iii) a technically successful pretreatment QA session on both EPID and ArcCHECK; and (iv) clinical delivery for at least five fractions. Plans were stratified by anatomical site to preserve the case-mix complexity of routine practice: head and neck (n = 42), prostate (n = 38), breast (n = 24), pelvis — cervix/rectum (n = 28), and thorax — lung/esophagus (n = 18).
Treatment planning, delivery, and measurement systems
All plans were optimized in Eclipse TPS v15.6 (Varian Medical Systems, Palo Alto, CA) with the Acuros XB algorithm on a 2.5-mm dose grid, and delivered on an Elekta Synergy accelerator (6 MV, 120-leaf Agility™ MLC). Two independent, complementary dosimetry systems were used for every plan. EPID dosimetry used the iViewDose™ platform (Elekta), with portal images acquired against a virtual 30 × 30 × 20 cm water-equivalent slab and converted to absolute dose maps through a calibration matrix refreshed monthly per the TG-218 protocol (spatial resolution, 0.4 mm/pixel). Array dosimetry used a cylindrical ArcCHECK™ phantom (Sun Nuclear, model 1220; 1386 SunPoint® diodes in a helical array), re-scanned into the TPS monthly and operated in continuous acquisition mode (50 Hz); detectors flagged as saturated or defective (<2% of the array) were excluded. Both systems underwent daily dose-constancy checks and monthly linearity, angular-dependence, and reproducibility QA. All measurements were performed by one of three certified medical physicists (≥ 3 years of VMAT QA experience) following a written standardized protocol, minimizing inter-operator variability as a confound.
Gamma analysis
Gamma calculations used SNC Patient™ v6.7 (Sun Nuclear) for ArcCHECK data and the integrated iViewDose module in Eclipse for EPID data, following the fast 3D gamma-evaluation formalism [17]. Four criteria were evaluated: 3%/3 mm (global, 10% threshold; the TG-218 reference criterion), 3%/2 mm (global, 10%), 2%/2 mm (global, 10%), and 3%/3 mm with local rather than global normalization (10%). GPR was defined as the percentage of evaluated points with γ ≤ 1; failure regions (γ > 1) were spatially mapped to characterize failure patterns, consistent with prior work linking MLC-positioning drift to localized gamma failures [18].
Correlation with clinical dosimetric deviations
To anchor GPR to clinically interpretable endpoints, measured dose distributions were reconstructed onto the original planning CT with a three-dimensional dose-reconstruction algorithm (3DVH, Sun Nuclear), following an approach comparable to that used to validate ArcCHECK for VMAT PSQA [19] and to derive institutional TL/AL elsewhere 8,10. Four DVH deviations were quantified: ΔD95 PTV (relative difference between measured and planned D95, %), ΔDmax OAR (absolute difference at the maximum-dose point, Gy), ΔDmean OAR (relative difference in mean OAR dose, %), and ΔVxGy (site-specific volumetric metric, e.g., lung V20Gy, in percentage points). A clinically significant error was pre-specified as ΔD95 PTV ≥ 3% or ΔDmax OAR ≥ 5%, consistent with institutional practice derived from ICRU Report 83 and with the error magnitudes used to benchmark gamma-based predictors elsewhere [20, 21].
Statistical analysis
GPR distributions were summarized by mean, median, standard deviation (SD), skewness, and kurtosis; because all four criteria showed marked left skewness, the median is reported alongside the mean as the more robust measure of central tendency, and Kruskal-Wallis rank tests were run in parallel with the ANOVA described below as a distribution-free check. Differences in GPR by measurement system (EPID vs ArcCHECK) and by anatomical site were tested with one-way ANOVA and Bonferroni-adjusted pairwise comparisons; the EPID–ArcCHECK paired difference is additionally reported as a mean ± SD with a 95% CI obtained from the paired standard error. Receiver-operating-characteristic (ROC) curves were constructed for each gamma criterion using the binary clinically-significant-error endpoint defined in §2.4; the area under the curve (AUC) quantified overall discrimination, and the Youden index (J = sensitivity + specificity − 1) was used, alongside pre-specified constraints of sensitivity ≥ 90% (action limit) and specificity ≥ 85% (tolerance limit), to select the operating point on each curve [22]. AUC confidence intervals were estimated by 2000-replicate stratified bootstrap resampling, and pairwise AUC comparisons (composite vs 3%/3 mm; EPID vs ArcCHECK) used the DeLong method for correlated ROC curves. Pearson correlation coefficients (r) between GPR and DVH metrics are reported with 95% CIs derived by Fisher z-transformation (SE = 1/√(n−3)), which is preferable to a point estimate alone when comparing correlation strength across metrics of differing clinical weight. A post-hoc power calculation based on the observed effect size for the primary correlation (composite GPR vs ΔD95 PTV) indicated that a sample of 150 plans provided >95% power to detect |r| ≥ 0.30 at α = .05, which contextualizes the width of the confidence intervals reported for the less prevalent subgroups. All analyses used Python 3.11 (SciPy 1.11, scikit-learn 1.3, pandas 2.1); two-sided P < .05 was considered significant throughout [Table 1].
| Plan characteristic | Value | Range (min–max) |
|---|---|---|
| Anatomical site, n (%) | ||
| Head and neck | 42 (28.0%) | — |
| Prostate | 38 (25.3%) | — |
| Breast | 24 (16.0%) | — |
| Pelvis (cervix/rectum) | 28 (18.7%) | — |
| Thorax (lung/esophagus) | 18 (12.0%) | — |
| Arcs per plan, n | 2.1 ± 0.4 | 1–3 |
| Prescribed dose, Gy | 54.8 ± 14.2 | 30.0–70.0 |
| Plan complexity, MU/Gy | 418 ± 87 | 245–672 |
| PTV volume, cm3 | 387 ± 312 | 28–1425 |
Table 1: Characteristics of the 150 analyzed VMAT plans, stratified by anatomical site. Plan complexity is expressed as the ratio of monitor units to Gray (MU/Gy); values are mean ± SD unless otherwise noted.
Results
Plan characteristics
The 150 included plans spanned a range of dosimetric complexity representative of routine VMAT casework [Table 1]. Mean prescribed dose was 54.8 ± 14.2 Gy (range, 30–70 Gy) and mean plan complexity was 418 ± 87 MU/Gy (range, 245–672), consistent with the complexity ranges reported in comparable institutional TL/AL derivations 8, 9.
Gamma passing-rate distributions
GPR distributions were consistently left-skewed across all four criteria (skewness, −1.3 to −2.1; Table 2, Figure 1), reflecting a workflow in which most plans cluster near-perfect agreement while a minority of outliers pulls the mean below the median. Mean GPR fell from 96.8 ± 2.4% at 3%/3 mm to 94.2 ± 3.1% at 3%/2 mm and 89.3 ± 4.8% at 2%/2 mm, the expected monotonic response to increasing criterion stringency. Switching from global to local normalization at 3%/3 mm reduced mean GPR to 95.1 ± 2.9%, consistent with the known sensitivity of local normalization to high-gradient regions. The proportion of plans below the unmodified TG-218 threshold of 90% rose from 4.7% (3%/3 mm) to 38.7% (2%/2 mm, Table 2), a near-tenfold amplification that illustrates how much a single criterion choice can shift the apparent failure rate of an otherwise identical dataset [Figure 1], [Table 2].
| Gamma criterion | Mean GPR (%) ± SD | Median GPR (%) | Plans <90% (%) | Plans <95% (%) |
|---|---|---|---|---|
| 3%/3 mm (global, 10%) | 96.8 ± 2.4 | 97.6 | 4.7 | 8.0 |
| 3%/2 mm (global, 10%) | 94.2 ± 3.1 | 95.1 | 12.7 | 22.0 |
| 2%/2 mm (global, 10%) | 89.3 ± 4.8 | 90.2 | 38.7 | 54.0 |
| 3%/3 mm (local, 10%) | 95.1 ± 2.9 | 96.0 | 8.0 | 14.7 |
| Composite (3%/2 mm + 2%/2 mm) | 91.8 ± 3.7 | 92.5 | 24.7 | 36.0 |
Table 2: Gamma passing-rate (GPR) distributions across the criteria evaluated in 150 VMAT plans. TG-218 threshold = 90%, shown for reference.
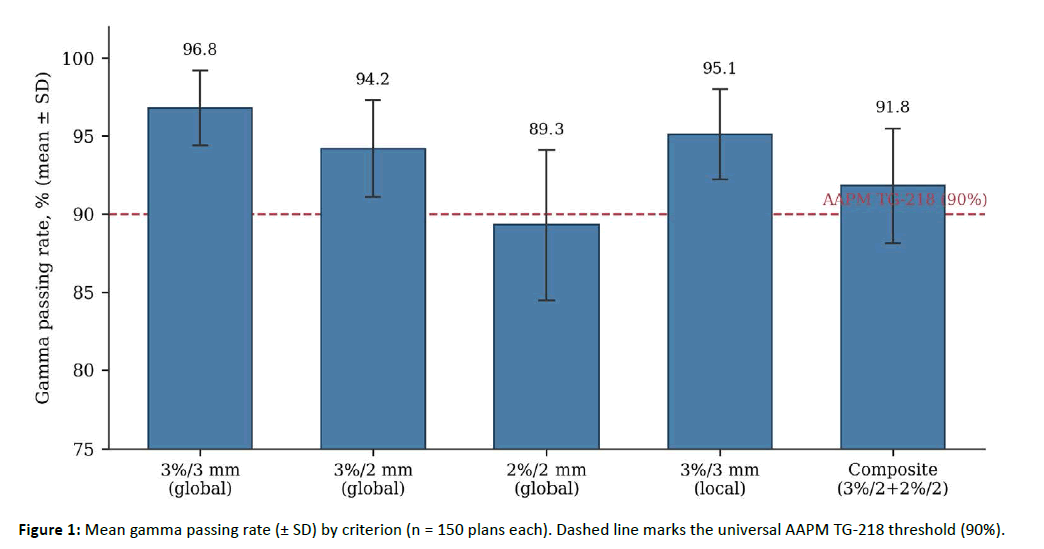
Figure 1. Mean gamma passing rate (± SD) by criterion (n = 150 plans each). Dashed line marks the universal AAPM TG-218 threshold (90%).
ROC-based derivation of local tolerance and action limits
ROC analysis identified criterion-specific operating points satisfying the pre-specified sensitivity/specificity targets [Table 3, Figure 2]. For the standard 3%/3 mm criterion, the action limit was 95% (sensitivity, 0.94; specificity, 0.89; Youden J = 0.83), five percentage points above the TG-218 universal value, with a corresponding 90% tolerance limit triggering mandatory 3D DVH recalculation. The intermediate 3%/2 mm criterion yielded 92%/87% (J = 0.76). The strict 2%/2 mm criterion produced the lowest specificity of the four criteria (0.81; false-positive rate, 19%; J = 0.69), a trade-off that we judged clinically unacceptable for routine deployment given the replanning burden it would generate.
| Gamma criterion | Action limit | Tolerance limit | Sensitivity | Specificity | J |
|---|---|---|---|---|---|
| 3%/3 mm (global, 10%) | 95% | 90% | 0.94 | 0.89 | 0.83 |
| 3%/2 mm (global, 10%) | 92% | 87% | 0.91 | 0.85 | 0.76 |
| 2%/2 mm (global, 10%) | 88% | 82% | 0.88 | 0.81 | 0.69 |
| Composite criterion | 90% | 85% | 0.93 | 0.87 | 0.80 |
Table 3 : Action and tolerance limits derived by ROC analysis for each gamma criterion. Sensitivity/specificity refer to detection of a clinically significant error (ΔD95 PTV ≥ 3% or ΔDmax OAR ≥ 5%); J, Youden index. The composite criterion, recommended as the primary institutional metric, is shown in bold.
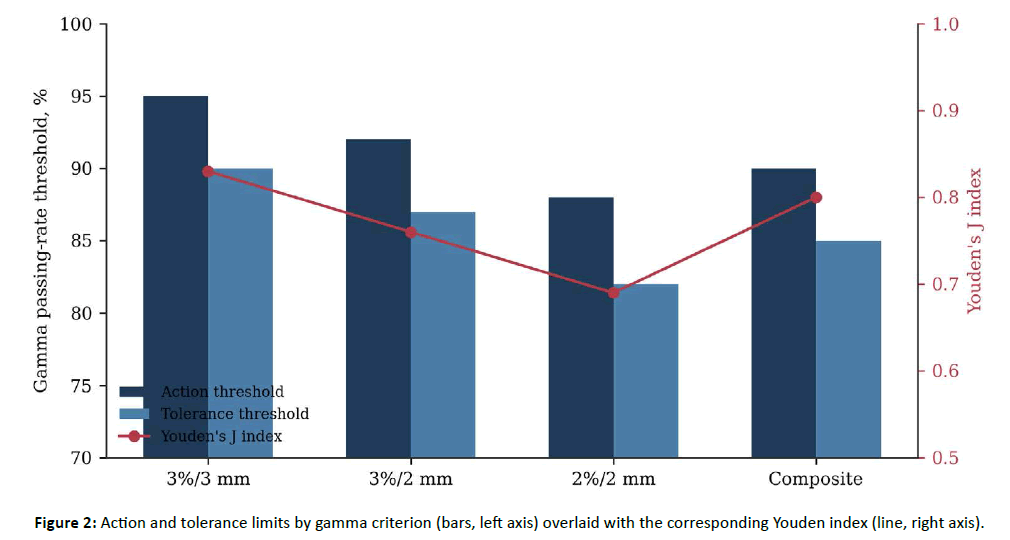
Figure 2. Action and tolerance limits by gamma criterion (bars, left axis) overlaid with the corresponding Youden index (line, right axis).
A composite criterion, the arithmetic mean of the 3%/2 mm and 2%/2 mm GPR, outperformed every individual criterion (AUC = 0.88; J = 0.80) at action/tolerance limits of 90%/85%, and was adopted as the primary institutional metric, with the legacy 3%/3 mm criterion retained as a secondary check for continuity with historical data and inter-center benchmarking, an approach conceptually aligned with the 2D/3D dual-metric strategy recently proposed for VMAT PSQA [10] [Table 3, Figure 2].
Correlation with clinical dosimetric deviations
GPR correlated inversely with every DVH deviation examined [Table 4, Figure 3]. The strongest association was between the composite criterion and ΔD95 PTV (r = −0.68; 95% CI, −0.76 to −0.58; P < .001; AUC = 0.84 for detecting errors ≥ 3%), indicating that as GPR fell, PTV underdosage rose in a statistically robust and clinically interpretable fashion. Correlations with OAR metrics were more modest (r = −0.45 to −0.61) but their 95% CIs excluded zero in every case, and corresponding AUCs remained in the good-to-excellent range (0.72–0.81), comparable to, and at the upper end of, previously reported gamma–DVH correlation strengths [21, 23]. The narrower CI around ΔD95 PTV relative to the OAR metrics reflects both the larger effect size and the reduced anatomical variability of a single, well-defined target-coverage endpoint.
| DVH metric | r (Pearson) | 95% CI | P value | AUC | Predictive value |
|---|---|---|---|---|---|
| ΔD95 PTV (%) | −0.68 | −0.76, −0.58 | <.001 | 0.84 | Excellent |
| ΔDmean OAR (%) | −0.61 | −0.70, −0.50 | <.001 | 0.81 | Excellent |
| ΔDmax OAR (%) | −0.52 | −0.63, −0.39 | <.001 | 0.76 | Good |
| ΔV20Gy lung (pp) | −0.45 | −0.57, −0.31 | .002 | 0.72 | Moderate |
Table 4 : Correlation between the composite gamma passing rate (3%/2 mm + 2%/2 mm) and clinical dosimetric deviations, reconstructed by 3DVH. AUC refers to detection of errors ≥ 3% (PTV) or ≥ 5% (OAR); pp, percentage points; CI, confidence interval (Fisher z).
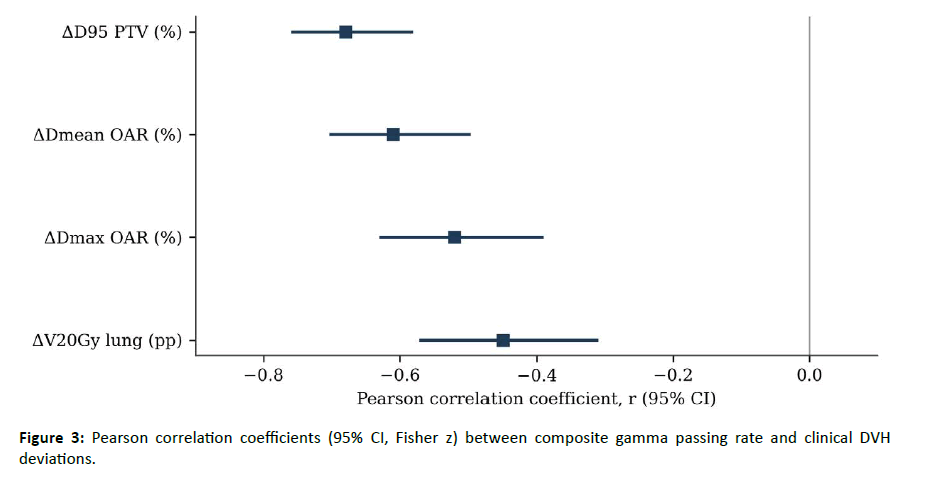
Figure 3. Pearson correlation coefficients (95% CI, Fisher z) between composite gamma passing rate and clinical DVH deviations.
EPID versus ArcCHECK agreement
EPID-derived GPR was systematically 1.2 ± 0.8 percentage points lower than ArcCHECK for the 3%/3 mm criterion (95% CI, 1.07–1.33; P < .001, paired t test), attributable to the finer spatial sampling of the EPID (0.4 mm native resolution vs 10-mm diode spacing, ArcCHECK). Despite this systematic offset, the two systems were diagnostically equivalent for detecting clinically significant errors (AUC, 0.83 vs 0.82; P = .71), corroborating earlier cross-platform comparisons [6] and supporting a workflow in which the EPID serves as the first-line, schedule-preserving check and ArcCHECK is reserved for confirmatory measurement of failing or exceptionally complex plans (MU/Gy > 600) [Table 4], [Figure 3,4].
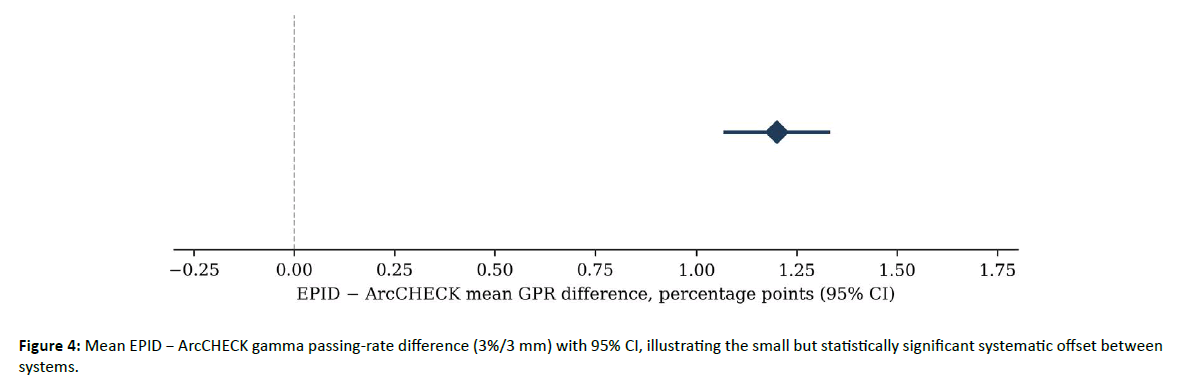
Figure 4. Mean EPID − ArcCHECK gamma passing-rate difference (3%/3 mm) with 95% CI, illustrating the small but statistically significant systematic offset between systems.
Discussion
To our knowledge, this study derives the first gamma-index tolerance and action limits validated against clinical dosimetric deviations for a VMAT program in Morocco. The resulting limits were systematically stricter than the TG-218 universal recommendation (a 95% versus 90% action limit for the standard 3%/3 mm criterion), and this five-point margin translated into a measurable clinical gain: sensitivity for clinical-error detection rose from 82% at the TG-218 threshold to 94% at the local threshold, while the false-positive rate stayed at an acceptable 11%. The direction of this shift closely tracks the pattern reported by other groups that re-derived TG-218 limits locally rather than adopting them by default [8, 9, 10]: institution-specific limits converge toward stricter values than the universal criterion, not laxer ones, which argues against the intuitive but mistaken assumption that resource-constrained centers should relax their QA tolerances to accommodate older equipment.
The pronounced left skewness of the GPR distributions (−1.3 to −2.1) reflects a QA workflow in mid-maturity, where most plans cluster near-perfect agreement and a minority of outliers pulls the mean below the median. The methodological implication is often overlooked in practice: because the distribution departs from normality, a threshold built purely from the mean and SD (e.g., mean − 2SD) will misestimate the tail behavior that actually drives clinical risk. Anchoring threshold selection to an independent clinical-error endpoint, as the ROC approach does here, rather than to distributional assumptions about GPR itself, avoids this pitfall and is the more defensible strategy for skewed QA metrics in general.
The moderate-to-strong, CI-bounded correlation between GPR and ΔD95 PTV (r = −0.68; 95% CI, −0.76 to −0.58) reinforces a finding that is easy to state but has been surprisingly hard to reproduce consistently in the literature: gamma-based metrics are clinically meaningful only when their acceptance criteria are calibrated against dose-volume endpoints, not assumed a priori [5, 20]. The AUC of 0.84 achieved here, and the 0.88 achieved by the composite criterion, sit at or above the upper end of AUCs reported for comparable gamma–DVH correlation studies [21-24], consistent with, though not proof of, the idea that local optimization recovers discriminatory power that a one-size-fits-all threshold leaves on the table. We would caution against over-interpreting this comparison across studies with different case mixes, detectors, and error-injection methodologies; the AUC values are broadly comparable, not identical in meaning.
The 1.2-percentage-point EPID–ArcCHECK offset, while statistically significant (95% CI excluding zero), is smaller than typical inter-measurement variability and did not translate into a measurable difference in clinical-error detection: the DeLong test comparing the two AUCs (0.83 vs 0.82) was non-significant (P = .71). This is reassuring operationally but does not remove the need for device-specific tolerance limits, a point TG-218 makes explicitly [3] and that our data corroborate quantitatively rather than qualitatively. In our workflow, the EPID is retained as the first-line system because it preserves machine scheduling, and ArcCHECK is reserved for confirmatory measurement of plans failing the EPID threshold or of unusually complex plans (MU/Gy > 600).
Persistent gaps in radiotherapy infrastructure and workforce capacity across Africa [11-14] mean that most centers on the continent still lack the retrospective measurement archives needed to reproduce this analysis today. The pipeline demonstrated here, systematic measurement archiving, 3D dose reconstruction, and ROC-anchored threshold selection, requires no equipment beyond what a standard VMAT QA program already has, making it a realistic near-term target as regional case volumes accumulate, though the statistical and 3DVH-reconstruction expertise it demands should not be underestimated. Machine-learning and deep-learning approaches that predict GPR directly from plan-complexity, log-file, or dose-plane features are advancing quickly, most recently with ensemble regressors for breast VMAT and 3D convolutional networks trained on leaf-position data [15, 25-31] represent a complementary, longer-term direction that could eventually reduce dependence on large measurement archives, including in the context of AI-assisted radiotherapy planning now being explored in Morocco [16], but such models still require a locally validated ground truth of the kind generated here to be trained and audited safely.
This study has several limitations. Its retrospective, single-center design limits direct extrapolation to other Moroccan or African centers running different linac–TPS–detector combinations; the numerical thresholds we report are configuration-specific, and the ROC-based derivation method, not the numbers themselves, is what we consider transferable. The cohort of 150 plans, while adequate for the ROC analyses performed, is modest next to some multi-institutional QA datasets, and the resulting confidence intervals, while informative, are correspondingly wider than a larger prospective cohort would allow, particularly for the less prevalent thoracic subgroup (n = 18). Our clinically-significant-error definition (ΔD95 ≥ 3%) reflects conservative institutional practice; centers using different error definitions (e.g., ±5% per ICRU 83) would shift the sensitivity–specificity trade-off and should re-run rather than import our operating points. Finally, because gamma performance and error-detection sensitivity are known to depend on institution-specific TPS algorithms, MLC design, and detector hardware [5, 6], we reiterate that the numerical thresholds reported here should not be adopted uncritically outside centers with a comparable technical configuration.
Future work should extend this database prospectively with clinical follow-up (toxicity, local control) to validate the long-term relevance of the derived limits, pursue a North African multicenter collaboration to test threshold transferability across centers with comparable equipment, and evaluate machine-learning GPR predictors [15] against this validated local ground truth rather than against the unmodified TG-218 criterion.
Conclusions
Locally derived, ROC-optimized gamma-index tolerance and action limits (95%/90% for 3%/3 mm; 90%/85% for the composite 3%/2 mm + 2%/2 mm criterion) were systematically stricter than the AAPM TG-218 universal recommendation in this Moroccan VMAT program, and improved clinical-error detection sensitivity from 82% to 94% at an acceptable 11% false-positive rate. The correlation between composite GPR and ΔD95 PTV (r = −0.68; 95% CI, −0.76 to −0.58; AUC = 0.84) supports the clinical relevance of these limits. The underlying methodology, comprising retrospective measurement archiving, 3D DVH reconstruction, and ROC-anchored threshold selection, is reproducible in other resource-constrained radiotherapy centers seeking evidence-based, context-specific QA tolerances, and offers a concrete step toward regionally grounded patient-specific QA practice in Africa.
Credit Authorship Contribution Statement
Adil El Badaoui: conceptualization, methodology, formal analysis, investigation, writing – original draft, writing – review and editing. Mourad Trihi: supervision, methodology, validation, writing – review and editing.
Declaration of Competing Interest
The authors declare no competing financial interests or personal relationships that could have influenced the work reported in this paper.
Funding
This research did not receive any specific grant from funding agencies in the public, commercial, or not-for-profit sectors.
Ethics Statement
This retrospective analysis of anonymized QA measurement data was conducted in accordance with institutional data-governance policy; no patient-identifying information was accessed or reported.
References
- Decabooter E, Essers M, Gershkevitsh E, Hussein M, Kry SF, et al. Patient specific quality assurance: the final safety net in radiotherapy. Radiother Oncol. 2026;221:111597.
- Low DA, Harms WB, Mutic S, Purdy JA. A technique for the quantitative evaluation of dose distributions. Med Phys. 1998;25:656–661.
- Miften M, Olch A, Mihailidis D, Moran J, Pawlicki T, et al. Tolerance limits and methodologies for IMRT measurement-based verification QA: recommendations of AAPM Task Group No. 218. Med Phys. 2018;45:e53–e83.
- Ezzell GA, Burmeister JW, Dogan N, LoSasso TJ, Mechalakos JG, et al. IMRT commissioning: multiple institution planning and dosimetry comparisons, a report from AAPM Task Group 119. Med Phys. 2009;36:5359–5373.
- Nelms BE, Zhen H, Tomé WA. Per-beam, planar IMRT QA passing rates do not predict clinically relevant patient dose errors. Med Phys. 2011;38:1037–1044.
- Hussein M, Rowshanfarzad P, Ebert MA, Nisbet A, Clark CH. A comparison of the gamma index analysis in various commercial IMRT/VMAT QA systems. Radiother Oncol. 2013;109:370–376.
- Hussein M, Clark CH, Nisbet A. Challenges in calculation of the gamma index in radiotherapy – towards good practice. Phys Med. 2017;36:1–11.
- Stasinou D, Patatoukas G, Kollaros N, Diamantopoulos S, Kypraiou E, et al. Implementation of TG-218 for patient-specific quality assurance tolerance and action limits determination: gamma passing rate evaluation using 3DVH software. Med Phys. 2022;49:4322–4334.
- Deng J, Liu SY, Huang Y, Li X, Wu X. Evaluating AAPM-TG-218 recommendations: gamma index tolerance and action limits in IMRT and VMAT quality assurance using SunCHECK. J Appl Clin Med Phys. 2024;25:e14277.
- Zarros C, Patatoukas G, Kollaros N, Chalkia M, Kougioumtzopoulou A, et al. From 2D to 3D gamma passing rate tolerance and action limits for patient-specific quality assurance in volumetric-modulated arc therapy. J Appl Clin Med Phys. 2025;26:e70025.
- Elmore SNC, Polo A, Bourque JM, Pynda Y, van der Merwe D, et al. Radiotherapy resources in Africa: an International Atomic Energy Agency update and analysis of projected needs. Lancet Oncol. 2021;22:e391–e399.
- Nadella P, Iyer HS, Manirakiza A, Vanderpuye V, Triedman SA, et al. Geographic accessibility of radiation therapy facilities in sub-Saharan Africa. Int J Radiat Oncol Biol Phys. 2023;115:557–563.
- Manson EN, Hasford F, Trauernicht C, Ige TA, Inkoom S, et al. Africa’s readiness for artificial intelligence in clinical radiotherapy delivery: medical physicists to lead the way. Phys Med. 2023;113:102653.
- Ramashia PN, Nkosi PB, Mbonane TP. Barriers to radiotherapy access in sub-Saharan Africa for patients with cancer: a systematic review. Int J Environ Res Public Health. 2024;21:1597.
- Ono T, Iramina H, Hirashima H, Adachi T, Nakamura M, et al. Applications of artificial intelligence for machine- and patient-specific quality assurance in radiation therapy: current status and future directions. J Radiat Res. 2024;65:421–432.
- Kouhen F, Naciri M, El Gouache H, Errafiy N, Maghous A. The promise of artificial intelligence-assisted radiotherapy for prostate cancer in Morocco: a transformational opportunity. Front Med (Lausanne). 2025;12:1577034.
- Wendling M, Zijp LJ, McDermott LN, Smit EJ, Sonke JJ, et al. A fast algorithm for gamma evaluation in 3D. Med Phys. 2007;34:1647–1654.
- Agnew A, Agnew CE, Grattan MWD, Hounsell AR, McGarry CK. Monitoring daily MLC positional errors using trajectory log files and EPID measurements for IMRT and VMAT deliveries. Phys Med Biol. 2014;59:N49–N63.
- Chaswal V, Weldon M, Gupta N, Chakravarti A, Rong Y. Commissioning and comprehensive evaluation of the ArcCHECK cylindrical diode array for VMAT pretreatment delivery QA. J Appl Clin Med Phys. 2014;15:4832.
- Nelms BE, Chan MF, Jarry G, Lemire M, Lowden J, et al. Evaluating IMRT and VMAT dose accuracy: practical examples of failure to detect systematic errors when applying a commonly used metric and action levels. Med Phys. 2013;40:111722.
- Stasi M, Bresciani S, Miranti A, Maggio A, Sapino V, Gabriele P. Pretreatment patient-specific IMRT quality assurance: a correlation study between gamma index and patient clinical dose-volume histogram. Med Phys. 2012;39:7626–7634.
- Carlone M, Cruje C, Rangel A, McCabe R, Nielsen M, et al. ROC analysis in patient specific quality assurance. Med Phys. 2013;40:042103.
- Zhen H, Nelms BE, Tomé WA. Moving from gamma passing rates to patient DVH-based QA metrics in pretreatment dose QA. Med Phys. 2011;38:5477–5489.
- Kry SF, Molineu A, Kerns JR, Faught AM, Huang JY, et al. Institutional patient-specific IMRT QA does not predict unacceptable plan delivery. Int J Radiat Oncol Biol Phys. 2014;90:1195–1201.
- Interian Y, Rideout V, Kearney VP, Gennatas E, Morin O, et al. Deep nets vs expert designed features in medical physics: an IMRT QA case study. Med Phys. 2018;45:2672–2680.
- Nyflot MJ, Thammasorn P, Wootton LS, Ford EC, Chaovalitwongse WA. Deep learning for patient-specific quality assurance: identifying errors in radiotherapy delivery by radiomic analysis of gamma images with convolutional neural networks. Med Phys. 2019;46:456–464.
- Granville DA, Sutherland JG, Belec JG, La Russa DJ. Predicting VMAT patient-specific QA results using a support vector classifier trained on treatment plan characteristics and linac QC metrics. Phys Med Biol. 2019;64:095017.
- Salari E, Xu KS, Sperling NN, Parsai EI. Using machine learning to predict gamma passing rate in volumetric-modulated arc therapy treatment plans. J Appl Clin Med Phys. 2023;24:e13824.
- Bin S, Zhang J, Shen L, Zhang J, Wang Q. Study of the prediction of gamma passing rate in dosimetric verification of intensity-modulated radiotherapy using machine learning models based on plan complexity. Front Oncol. 2023;13:1094927.
- Djoumessi Zamo FC, Colliaux A, Blot-Lafond V, Moyo N, Njeh CF. Enhancing patient-specific quality assurance for VMAT for breast cancer treatment: a machine learning approach for gamma passing rate (GPR) prediction. J Appl Clin Med Phys. 2025;26:e70251.
- Berchtold J, Vockner S, Messner I, Stana M, Röder F, et al. Prediction of VMAT gamma passing rates using 3D CNNs based on leaf position analysis and gradient class activation mapping for plan complexity evaluation. Med Phys. 2026;53:e70468.
[Cross ref], [Google scholar], [PubMed]
[Cross ref], [Google scholar], [PubMed]
[Cross ref], [Google scholar], [PubMed]
[Cross ref], [Google scholar], [PubMed]
[Cross ref], [Google scholar], [PubMed]
[Cross ref], [Google scholar], [PubMed]
[Cross ref], [Google scholar], [PubMed]
[Cross ref], [Google scholar], [PubMed]
[Cross ref], [Google scholar], [PubMed]
[Cross ref], [Google scholar], [PubMed]
[Cross ref], [Google scholar], [PubMed]
[Cross ref], [Google scholar], [PubMed]
[Cross ref], [Google scholar], [PubMed]
[Cross ref], [Google scholar], [PubMed]
[Cross ref], [Google scholar], [PubMed]
[Cross ref], [Google scholar], [PubMed]
[Cross ref], [Google scholar], [PubMed]
[Cross ref], [Google scholar], [PubMed]
[Cross ref], [Google scholar], [PubMed]
[Cross ref], [Google scholar], [PubMed]
[Cross ref], [Google scholar], [PubMed]
[Cross ref], [Google scholar], [PubMed]
[Cross ref], [Google scholar], [PubMed]
[Cross ref], [Google scholar], [PubMed]
[Cross ref], [Google scholar], [PubMed]
[Cross ref], [Google scholar], [PubMed]