Research Article - Onkologia i Radioterapia ( 2023) Volume 17, Issue 9
Effect of betel oil on of normal and cancer cells lines
Zainab H.A. Al-Batat* and Ali A.A. Al-AliZainab H.A. Al-Batat, Department of Biology, College of Education for pure sciences, University of Basrah, Basrah, Iraq, Email: ozaalbatat@gmail.com
Received: 06-Jun-2023, Manuscript No. OAR-23-101560; Accepted: 20-Oct-2023, Pre QC No. OAR-23-101560 (PQ); Editor assigned: 25-Jun-2023, Pre QC No. OAR-23-101560 (PQ); Reviewed: 26-Jul-2023, QC No. OAR-23-101560 (Q); Revised: 28-Aug-2023, Manuscript No. OAR-23-101560 (R); Published: 25-Oct-2023
Abstract
The present research concentrates on using both synthetic medications (metformin) and biological substances (betel oil) to use the MTT viability experiment to determine their toxicity against the cancer cell types AMGM-5, A549, HCAM, HCT-8, and HeLa as well as the normal cell type HBL100. The result shows decreased cell viability treated with betel oil and metformin. IC50 value of betel oil in A549, HCAM and HCT-8 was 12.5 µg/ml, 21.2 µg/ml, 12.6 µg/ml respectively, while the killing rates did not reach 50% for each of HBL-100, AMGM-5 and HeLa. Acridine orange/Ethidium bromide, Eosin and Hematoxylin after transaction betel oil and metformin were used to examine the structural and apoptotic changes in the cell lines. These changes included apoptosis and degradation as well as the appearance of necrotic cells.
Keywords
cell line, betel oil, metformin
Introduction
A major cause of death worldwide, cancer is a serious public health concern. Additionally, it hinders global efforts to raise life expectancy. Incidence and mortality from cancer are also rising steadily on a worldwide scale [1]. Patients' access to adequate treatment options is limited by the complexity and variety of their tumours, which calls for specialized or targeted therapies. The majority of cancer types are not effectively treated by current chemotherapy regimens. Healthy cells are negatively impacted by chemotherapy, being one of its major drawbacks, and is a due to the non-selectivity of the opiates used during this procedure [2, 3].
The cytotoxic and anti-proliferative effects of some Essential Oils (EOs) on cancer cell lines or test animals have been identified as possible anticancer medicines. EOs' or their constituents' cytotoxic effects, various mechanisms have been reported. Cell cycle arrest, antimutagenic, anti-proliferative, antioxidant capabilities, and promotion of cell death by apoptosis or necrosis, and loss of essential organelle functions are a few of these. Manufactured compounds have an important role to prevent and treat diseases. Where the pharmaceutical industry contributed in saving humanity from diseases, as the Metformin was used as a drug that has effectiveness against cancer for the purpose of comparison and confirmation. A crucial part of cancer treatment is combination therapy, which involves combining two or more medications [4]. Combining anti-cancer medications is more effective than monotherapy because it targets important pathways in such a synergistic or additive manner. With therapeutic anti-cancer actions include reducing tumour growth and spreading potential, blocking mitotically active cells, reducing cancer stem cell populations, and inducing apoptosis, this approach may lessen the formation of drug resistance [5].
The goal of the current study is to evaluate how metformin and betel oil affect cancer cell proliferation, and the cytotoxicity of study samples on cell lines is examined in order to determine the inhibitory concentrations, or IC50. Using the Camposyan Isobologram, analyse the cumulative impact of biological substances. Utilizing AO/EB and HandE dye to investigate the cytopathic effects of the study materials
Materials and techniques
Maintenance costs and multiplication of cell cultures
The AMGM-5, A549, HBL-100, HCAM, HCT-8 and HeLa cancer and normal cell lines was provided by tissue culture laboratory in the Department Biology, College of Education for Pure Sciences. The cells were kept in RPMI-1640 supplemented with 10% fetal bovine, 100 g/mL streptomycin, and 100 unit's/mL penicillin after they had achieved confluence. In a nutshell, cells were wash with PBS solution, then detached from the flask using a millilitre of TrypsinEDTA solution. Suspended cells were then seeded in a 25 cm flask at 37 degrees using RMPI 1640 medium supplemented with 10% (v/v) fetal bovine serum (FBS), 100 g/mL streptomycin, and 100 U/mL penicillin. The suspension cells split in half, these cells were then reseeded in a new flask with 5 ml of RPMI-1640 supplemented with 10% fetal bovine serum, and they were incubated 5% CO2 and at 37°C. This process was done twice weekly until the cell culture achieved 80% confluence [6].
Assays for cytotoxicity
The MTT (3-(4,5-dimethylthiazol-2-yl)-2,5- diphenyltetrazolium bromide) assay was used to determine the cytotoxicity of betel oil and metformin on the AMGM-5, A549, HCAM, HCT-8, and HeLa cells lines. After trypsinization, the suspension cells were seeded 1x10/100ul per well in a 96-well plate and incubated for a confluent monolayer was attained at 37°C with CO2. Cells were treated with five different concentrations of pure Betel oil derived from Peper betel (1 µg/ml, 5 µg/ml, 10 µg/ml, 30 µg/ml, 50 µg/ml) and five concentrations of Metformin (3 mM/ml, 9 mM/ml, 24 mM/ml, 48 mM/ml, 96 mM/ml). In order to determine the viability of cells after 72 hours of exploration, an MTT solution 90 µl serum-free media and 10 µl MTT (5 mg/mL) were added to each well for 2h. After incubating the precipitates for 20 minutes in DMSO, in order to measure the absorbance of 490 nm, a microplate reader was [7]. The numbers shown are the averages and ranges of three separate experiments that were carried out in triplicate. The following equation was used to assess the viability rate for cells:
the vitality rate is computed as VR=B/A*100, where A is the mean device density of untreated repeaters and B is the device density of treated repeaters, and the inhibition rate is determined as IR=100–PR [8].
50% inhibitory concentration (IC50) for cell death
The IC50 concentrations of metformin and betel oil were determined by the Graph Pad Prism 7 software. Three repetitions of inhibition at each concentration were used to calculate the IC50 for the AMGM-5, A549, HBL-100, HCAM, HCT-8, and HeLa cell lines.
The combined effect of metformin and betel oil
Compusyn software version 1 was also used to examine the results. Cells were given five concentrations of metformin and betel oil (1 µg/ml and 3mM/ml, 5 µg/ml and 9mM/ml, 10 µg/ml and 24mM/ml, 30 µg/ml and 48mM/ml and 50 µg/ml and 96mM/ml). Control cells were those that weren't treated We incubated treated and untreated cells at 37°C and 5% CO2 for 72 h in a humidification incubator. Inhibition rate after exposure was calculated using the MTT assay (Table 1) [9].
Tab. 1. Signs for synergism and antagonism in combination index analysis
| Combination Index | Description |
|---|---|
| CI<1 | Synergism |
| CI=1 | Nearly Additive |
| CI>1 | Antagonism |
Study of cell morphology
Haematoxylin and eosin dyeing
Cells planted on coverslips (7 105 cells/cover) within plate 6 were treated to the IC50 doses of metformin and betel oil after the cell culture had developed a confluent monolayer. As a control the other coverslips, were left untreated, the plate was then wrapped in glued paper and incubated at 24 hours at 37°C with 5% CO2 in a humidified environment. After 24 hours of treatment, a treated and untreated cell on coverslip was stained in haematoxylin and eosin dye, to evaluate morphological changes, observed under a light microscope [10].
Acridine orange/ethidium bromide AO/EB dyeing
To study apoptosis a dye was used AO/EB, repetition of earlier cell seeding stages was done. AO (5 mg/ml) and EB (3 mg/ml) were used to stain the cells, which were subsequently seen under a fluorescence microscope [11].
Crystal violet dye
The study materials' IC50 concentration was applied to the cells planted on a 24-well plate at an intensity of 2*104, and they were then incubated for 24 hours at 37°C with 5% CO2 in a humidified environment, then dyed with crystal violet for at room temperature for twenty minutes, then cleaned with water.
Results
Cytotoxicity assays of metformin and betel oil in cells lines
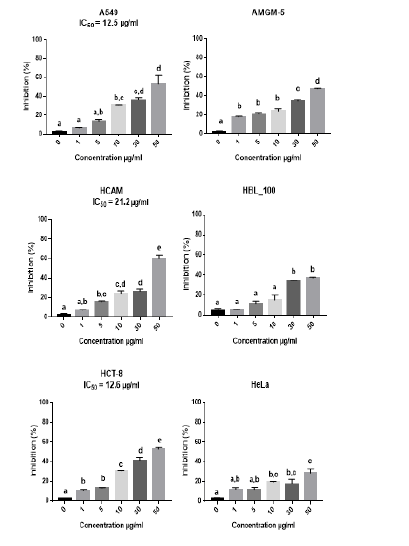
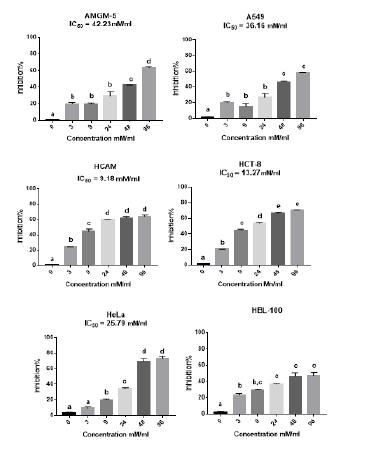
The study used MTT calorimetry to determine how betel oil and metformin affected the cells lines. This experiment proved that betel oil and metformin were cytotoxic to the viability of the cell lines. The MTT assay results after 72 hours showed that betel oil and metformin suppress cells lines growth. Betel oil had a dose-dependent effect, meaning that as concentrations rose, so did the effect. The value of inhibitor for a high concentration of betel oil 5 µg/ml for cells lines is 53.41% in A549, 47.38% in AMGM-5, 59.85% in HCAM, 52.46% in HCT-8, 37.29% in HBL-100 and 28.10% in HeLa. The present analysis confirms that the betel oil's 50% inhibitory concentration IC50 is 12.5 µg/ml in A549, 21.2 µg/ml in HCAM, 12.6 µg/ml in HCT-8, while the killing rates did not reach 50% for each of HBL-100, AMGM-5 and HeLa (Figure 1). Additionally, metformin impact grew directly proportionate to its concentration; the cells lines-specific inhibitory effect of a high dose of metformin, 96 mM/ml is 63.39% in AMGM-5, 58.06% in A549, 64.14% in HCAM, 70.51% in HCT-8, 72.93% in HeLa and 47.60% in HBL-100. The present analysis confirms that the metformin 50% inhibitory concentration IC50 is 24.23mM/ml in AMGM-5, 36.16 mM/ml in A549, 13.27 mM/ml in HCT-8, 9.18 mM/ml in HCAM and 25.79 mM/ml in HeLa while the killing rates did not reach 50% for each of HBL-100 (Figure 2).
Figure 1: Inhibition rates of cell lines treated with a series of concentrations of betel oil
Figure 2: Inhibition rates of cell lines treated with a series of concentrations of metformin
The combined effects of metformin and betel oil
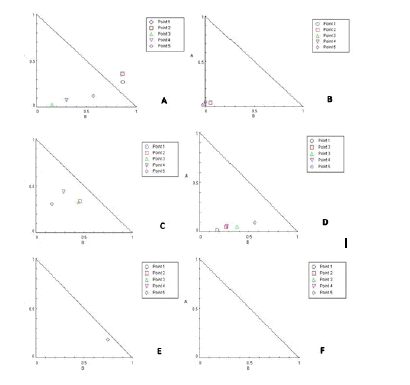
Data on the Combination Index (CI) for five betel oil and metformin concentrations (1 µg/ml+3 mM/ml, 5 µg/ml+9 mM/ml, 10 µg/ml+24 mM/ml, 30 µg/ml+48 mM/ml, and 50 µg/ml+96 mM/ml) in cell lines after a 72 hours. According to CI data, betel oil and metformin have a synergistic impact at high concentrations CI<1 at three points in AMGM-5, at four point in A549 and HBL-100, one point in HCAM and all point in HCT-8 however at low concentrations points 1 and all point in HeLa (CI>1), have an antagonistic effect except HCT-8 (Table 2-7 and Figure 3).
Tab. 2. Value of CI for the A549 cell line treated for 72 hours with the material combination (oil+met)
| Dose oil | Dose met. | effect | CI |
|---|---|---|---|
| 1 µg/ml | 3 mM/ml | 0.103 | 2.57376 |
| 5 µg/ml | 9 mM/ml | 0.321 | 0.79451 |
| 10 µg/ml | 24 mM/ml | 0.448 | 0.77481 |
| 30 µg/ml | 48 mM/ml | 0.599 | 0.72639 |
| 50 µg/ml | 96 mM/ml | 0.742 | 0.47696 |
Tab. 3. Value of CI for the HBL-100 cell line treated for 72 hours with the material combination (oil+met)
| Dose oil | Dose met. | effect | CI |
|---|---|---|---|
| 1 µg/ml | 3 mM/ml | 0.147 | 9.89714 |
| 5 µg/ml | 9 mM/ml | 0.49 | 0.10162 |
| 10 µg/ml | 24 mM/ml | 0.721 | 0.02146 |
| 30 µg/ml | 48 mM/ml | 0.764 | 0.03937 |
| 50 µg/ml | 96 mM/ml | 0.77 | 0.0628 |
Tab. 4. Value of CI for the AMGM-5 cell line treated for 72 hours with the material combination (oil+ met)
| Dose oil | Dose met. | effect | CI |
|---|---|---|---|
| 1 µg/ml | 3 mM/ml | 0.0623 | 17.6108 |
| 5 µg/ml | 9 mM/ml | 0.268 | 1.31062 |
| 10 µg/ml | 24 mM/ml | 0.424 | 0.76385 |
| 30 µg/ml | 48 mM/ml | 0.492 | 0.97602 |
| 50 µg/ml | 96 mM/ml | 0.717 | 0.31303 |
Tab. 5. Value of CI for the HCT-8 cell line treated for 72 hours with the material combination (oil+met)
| Dose oil | Dose met. | effect | CI |
|---|---|---|---|
| 1 µg/ml | 3 mM/ml | 0.481 | 0.20008 |
| 5 µg/ml | 9 mM/ml | 0.587 | 0.32601 |
| 10 µg/ml | 24 mM/ml | 0.683 | 0.43044 |
| 30 µg/ml | 48 mM/ml | 0.801 | 0.33857 |
| 50 µg/ml | 96 mM/ml | 0.801 | 0.65763 |
Tab. 6. Value of CI for the HCAM cell line treated for 72 hours with the material combination (oil+met)
| Dose oil | Dose met. | effect | CI |
|---|---|---|---|
| 1 µg/ml | 3 mM/ml | 0.139 | 6.16298 |
| 5 µg/ml | 9 mM/ml | 0.21 | 7.17792 |
| 10 µg/ml | 24 mM/ml | 0.52 | 1.21438 |
| 30 µg/ml | 48 mM/ml | 0.543 | 2.15576 |
| 50 µg/ml | 96 mM/ml | 0.723 | 0.93247 |
Tab. 7. Value of CI for the HeLa cell line treated for 72 hours with the material combination (oil+met)
| Dose oil | Dose met. | effect | CI |
|---|---|---|---|
| 1 µg/ml | 3 mM/ml | 0.119 | 11.8191 |
| 5 µg/ml | 9 mM/ml | 0.508 | 4.67511 |
| 10 µg/ml | 24 mM/ml | 0.793 | 3.49067 |
| 30 µg/ml | 48 mM/ml | 0.823 | 5.78473 |
| 50 µg/ml | 96 mM/ml | 0.83 | 11.034 |
Figure 3: Inhibition betel oil and metformin, at various doses, exhibit synergistic effects on cell lines after 72 hours of therapy, according to an isobologram analysis (A). AMGM-5, (B). A549 (C). HBL-100 (D). HCT-8 (E). HCAM and (F). HeLa
Exploration of cell morphology
Studying morphological changes
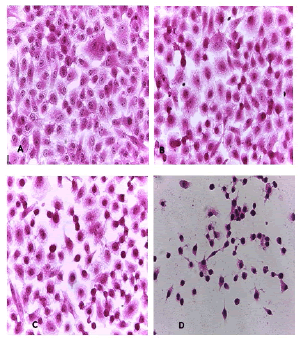
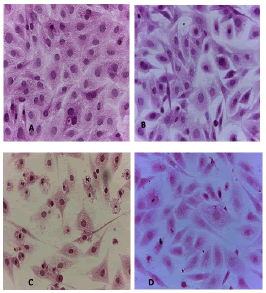
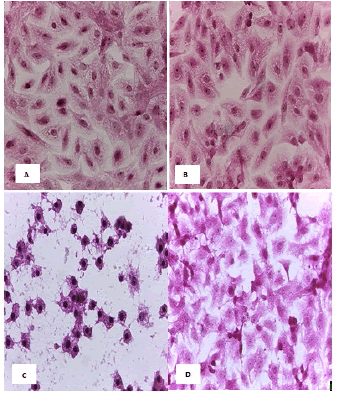
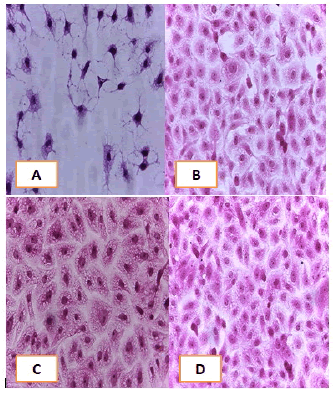
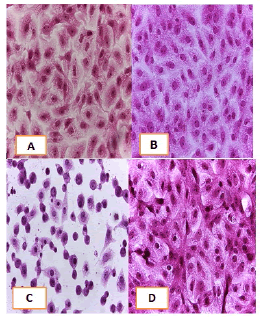
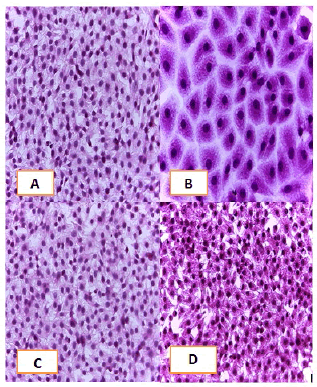
Cell lines underwent a variety of cyto pathological changes that could be observed under a microscope after being exposed to the substances (Betel oil, Metformin, and combined effect) for 24 hours. The morphological alterations showed a striking resemblance among cell lines that were exposed to the chemicals. Atrophy of cells and their spherical and abnormal shapes are hallmarks of the cytopathic effect. Additional anomalies observed in cell cultures include large voids that developed as result of cell degeneration, shrinkage, and collapse. These persistent morphological changes were brought on by the exposure of betel oil, which was accompanied by hyperchromy and karyopyknosis of the nuclei. Karyopyknosis is one of the characteristics of a cell going through apoptosis. Necrosis is yet another form of cell destruction that has been observed. Additionally, the treated cells showed signs of cytoplasmic vacuolation. Betel oil-treated cells underwent apoptosis, as shown by the emergence of apoptotic bodies and DNA fragmentation. Multinucleated cells also appeared in other cases. The administration of metformin and the combo effector had no discernible impact (Figure 4-9).
Figure 4: HandE stain was used to stain the A549 cells line at 40 x strength. (A). monolayer of flat cells with big nuclei makes up the appearance of untreated cells (B). Cells treated with IC50 concentration of Metformin did not show pathological changes on the cells (C). Cells treated with IC50 concentration of oil showed some pathological changes on the cells (D). Cells treated with IC50 concentration of oil and IC50 concentration of metformin did not show pathological changes on the cells
Figure 5: HandE stain was used to stain the AMGM-5 cells line at 40 x strength (A). Monolayer of flat cells with big nuclei makes up the appearance of untreated cells (B). cells treated with IC50 concentration of Metformin did not show pathological changes on the cells (C). Cells treated with IC50 concentration of oil showed some pathological changes on the cells (D). Cells treated with IC50 concentration of oil and IC50 concentration of metformin did not show pathological changes on the cells
Figure 6: Hand E stain was used to stain the HCAM cells line at a 40 x strength. (A). monolayer of flat cells with big nuclei makes up the appearance of untreated cells. (B). cells treated with IC50 concentration of Metformin did not show pathological changes on the cells (C). Cells treated with IC50 concentration of oil showed some pathological changes on the cells, (D). cells treated with IC50 concentration of oil and IC50 concentration of metformin did not show pathological changes on the cells
Figure 7: Hand E stain was used to stain the HCT-8 cells line at 40 x strength (A). monolayer of flat cells with big nuclei makes up the appearance of untreated cells (B). Cells treated with IC50 concentration of Metformin did not show pathological changes on the cells (C). Cells treated with IC50 concentration of oil showed some pathological changes on the cells, (D). cells treated with IC50 concentration of oil and IC50 concentration of metformin did not show pathological changes on the cells
Figure 8: HandE stain was used to stain the HeLa cells line at a 40 x strength. (A). monolayer of flat cells with big nuclei makes up the appearance of untreated cells (B). Cells treated with IC50 concentration of Metformin did not show pathological changes on the cells (C). Cells treated with IC50 concentration of oil showed some pathological changes on the cells, (D). cells treated with IC50 concentration of oil and IC50 concentration of metformin did not show pathological changes on the cells
Figure 9: HandE stain was used to stain the HBL-100 cells line at 40 x strength (A). Monolayer of flat cells with big nuclei makes up the appearance of untreated cells (B). cells treated with IC50 concentration of Metformin did not show pathological changes on the cells (C). Cells treated with IC50 concentration of oil showed some pathological changes on the cells (D). Cells treated with IC50 concentration of oil and IC50 concentration of metformin did not show pathological changes on the cells
Apoptosis study
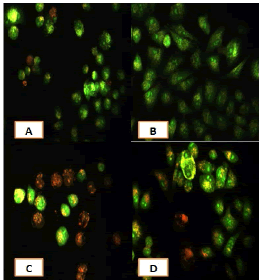
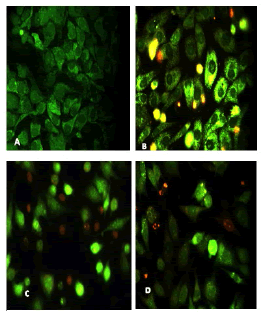
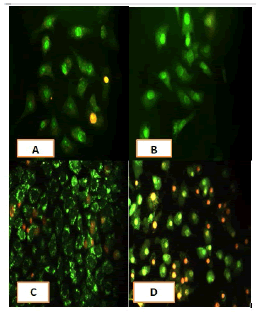
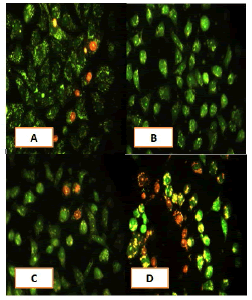
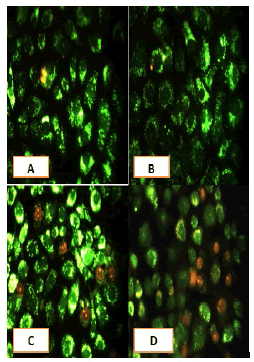
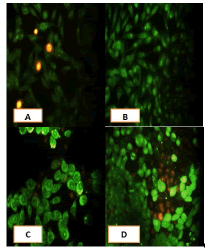
After 24 hours of incubation, the untreated and treated cells lines for metformin and combination effect showed a fusiform shape of green cytoplasm and nuclei as proof of the viability of the cells and that they were not vulnerable to apoptosis. However, some of the treated cells lines showed signs of specific genetic apoptotic changes after 24 hours of exposure to the IC50 concentrations of betel oil, including lysis of cytoplasm with yellow-green nucleus as an early apoptotic as well as some cells of red as late apoptotic (Table 8, Figure 10-15).
Tab. 8. Depicts the percentage of living cells and dead cells for the cells lines after being treated with metformin, oil, or both at the same time
| The percentage of death cells | The percentage of living cells | Type of treatment |
|---|---|---|
| AMGM-5 | ||
| 6.872 | 93.127 | Control |
| 30.028 | 69.971 | Metformin |
| 52.947 | 47.052 | Oil |
| 16.722 | 83.277 | Combination |
| A549 | ||
| 5.328 | 94.671 | Control |
| 20.748 | 79.251 | Metformin |
| 74.359 | 25.64 | Oil |
| 12.051 | 87.948 | Combination |
| HCAM | ||
| 4.876 | 95.123 | Control |
| 2.451 | 97.548 | Metformin |
| 60.396 | 39.603 | Oil |
| 33.822 | 66.177 | Combination |
| HCT-8 | ||
| 0.469 | 99.53 | Control |
| 11.346 | 88.653 | Metformin |
| 50.208 | 49.791 | Oil |
| 8.739 | 91.26 | Combination |
| HeLa | ||
| 2.678 | 97.321 | Control |
| 2.581 | 97.418 | Metformin |
| 6.646 | 93.353 | Oil |
| 11.168 | 88.831 | Combination |
| HBL-100 | ||
| 2.1 | 97.899 | Control |
| 2.116 | 97.883 | Metformin |
| 11.392 | 88.607 | Oil |
| 5.301 | 94.698 | Combination |
Figure 10: Analysis of the A549 cells line morphology after 40X AO/EB staining (A). Unprocessed cells (B). Cells treated the with IC50 of met (C). Cells treated also with IC50 of betel oil D: Cells treated also with IC50 of betel oil+met; the living cells (green cells); the apoptotic cells (yellow cells and red cells)
Figure 11: Analysis of the AMGM-5 cells line morphology after 40X AO/EB staining (A). Unprocessed cells (B). Cells treated the with IC50 of met (C). Cells treated also with IC50 of betel oil (D). Cells treated also with IC50 of betel oil+met; the living cells (green cells) the apoptotic cells (yellow cells and red cells)
Figure 12: Analysis of the HCAM cells line morphology after 40X AO/EB staining. (A). Unprocessed cells (B). Cells treated the with IC50 of met; C: Cells treated also with IC50 of betel oil D: Cells treated also with IC50 of betel oil+met; the living cells (green cells); the apoptotic cells (yellow cells and red cells)
Figure 13: Analysis of the HCT-8 cells line morphology after 40X AO/EB staining (A). Unprocessed cells. (B). Cells treated the with IC50 of met; (C). Cells treated also with IC50 of betel oil (D). Cells treated also with IC50 of betel oil+met; the living cells (green cells); the apoptotic cells (yellow cells and red cells)
Figure 14: Analysis of the HeLa cells line morphology after 40X AO/EB staining (A). Unprocessed cells. (B). Cells treated the with IC50 of met (C). Cells treated also with IC50 of betel oil; (D). Cells treated also with IC50 of betel oil+met; the living cells (green cells); the apoptotic cells (yellow cells and red cells)
Figure 15: Analysis of the HBL-100 cells line morphology after 40X AO/EB staining (A). Unprocessed cells (B). Cells treated the with IC50 of met; (C). Cells treated also with IC50 of betel oil (D). Cells treated also with IC50 of betel oil+met; the living cells (green cells); the apoptotic cells (yellow cells and red cells)
Crystal violet dye
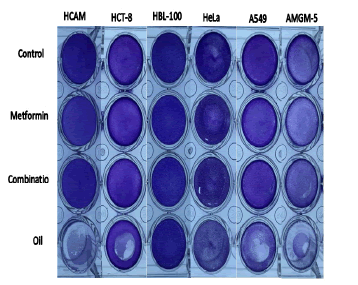
In order to look into how research materials, affect cell viability and changes in cell viability while exposed to study materials which kill cells, crystal violet dye was utilized. The cells exhibit less crystal violet dye when treated with betel oil than the control group because they are removed from the tissue culture plates after cell death and exhibit dark colour when treated with met and combined effect, indicator of its unaffectedness (Figure 16).
Figure 16: use crystal violet dye to measure cell death over a 24-hour period
Discussion
Researchers are searching for alternatives to chemotherapy that are both more effective against cancers and less harmful to the patient because chemotherapy has so many unfavourable side effects. Use of organic plant compounds is one of the proposed substitute methods [12]. Therefore, research has focused on identifying the active ingredients present in plants such as Piper betel. Natural oils defined as essential oils, which come from plant genes, are widely used in medicine, involving the prevention and therapy of cancer. Previous studies have shown the cytotoxic effects for essential oils on cells [13]. Several human cancer cell lines, including SK-GT-4, have had their development inhibited as a result of essential oils [14]. AMJ-13, HCAM and HBL-100 [15]. A549 and 22RV-1 MDAMB-321 [16]. The essential oil of piper betel is also toxic to the cancer cells lines AMGM-5, A549, HCT-8, HCAM HeLa and HBL-100 and our MTT assay findings revealed that the essential oil produced a concentration-dependent cytotoxic impact on cells lines. As is observed Decatropis bicolour oil, eucalyptus oil Lavender oil and Navel orange oil [17]. this might be brought on by the proximity of the essential oil's constituents, which are present in different amounts and each have specific proportion’s. Or because the essential oil contains a variety of bioactive compounds, such as terpenes and phenols [18]. The present research used the MTT method to get betel oil's half-cells inhibitor concentration (IC50). The IC50 concentration values varied depending on of plant species used to make the oil and type cell line. The betel oil's IC50 concentration on cells lines A549, HCT-8, HCAM is (1.25, 1.26, 2.12 µg/ ml) respectively. While the percentage of inhibition did not reach 50% in cell lines AMGM-5, HeLa and HBL 100. However, an American National Center Institute claims that the only extracts with IC50 levels against experimental tumour cell lines which are less than 30 g/ml are the most efficient anticancer agents for the development of new drugs [19].
A trend in research is to evaluate the efficacy of new drugs or compounds based on side effects, such as drugs for type 2 diabetes. And since metformin was one of those medications, it was utilized in the present research for comparison and confirmation reasons. To develop more potent anti-cancer compounds against the tumour, manufactured medicines were used as anti-cancer treatment. According to cell viability studies, metformin has the ability to decrease the proliferation of A549, HCT-8, HCAM, AMGM-5, HeLa and HBL-100 cells lines, while these effects were increased by raising the concentration. On the 5637 and T24 cell line, HeLa, HBL-100, HCAM, AMJ-3 andA172 cell line and H1299 and A549 cell line [20, 21]. When metformin was used to treat various cancer cell lines, it was noticed that there was a sizable variance in the values of the IC50. 3.2mM in NCI-H2087 cell line, 19.43mM in SiHa cell line 25, 13 mm in HeLa [22, 23]. The findings of the present study between cancer cell lines also showed this variation in IC50 values [24]. The various characteristics of the cells lines and the degree of growth from which they were derived may be the cause of this. According to their capacity for mitosis or the speed of their reproduction, cell types can also vary. Because cells use up their energy stores more quickly with a quicker replication period, they are more sensitive to and have a larger impact on the therapy materials. The normal cell line HBL-100, on the other hand, did not yield an IC50 value, indicating that it is less susceptible to metformin compared to cancer cell lines. If Otto Warburg observed that cancer cells' biochemical characteristics were different from those of healthy cells, [25].
Betel oil alone is toxic to cell types. Because it contains several active substances with an anticancer impact [26, 27]. The current research used metformin, a drug known for having an inhibitory impact on cancer cells [28]. to explore its synergistic function with essential oil as one of the latest trends. Using MTT technology, the findings demonstrated a synergistic impact of the combination of betel oil and metformin against the A549, AMGM-5, HBL-100, HCAM, HCT-8 and HeLa cell lines. In the cell lines A549, AMGM-5, HBL-100, and HCAM, low amounts failed to inhibit cells by 50%, indicating that the combined impact is ineffective that is, there is no benefit to taking betel oil with metformin. The cells lines mentioned above therefore respond better to the oil alone. While the proportion of inhibition at modest concentrations in the two cancer cell lines HeLa and HCT-8 approached 50%, suggesting the potential for using a combo treatment of betel oil and metformin in the cervical cancer cell line HeLa and in the colon cancer cell line HCT-8.
These structural changes in the betel oil-treated cells lines are the result of molecular and metabolic processes. The size, structure, cytoplasm, and nucleus of a dead cell are all distinctive. The changes in cells lines are explained by us as the emergence of different apoptotic phases. The cytoskeleton plays a significant role in the maintenance of cell shape. These events can explain why the cells' cytomorphological changes. Large gaps that appeared in cell colonies as a consequence of dead cells and multinucleated cells may have been caused by cell fusion or a cytokinesis issue. In the treated cells, cytoplasmic vacuolation was observed as a preventative step to keep Betel oil out of the interior environment. necrosis as a consequence, which free radicals could induce. When metformin and the combo effector were used, there were no noticeable effects; however, this may be because metformin wasn't causing apoptosis, as shown by the analysis of apoptosis using AO/EB dye. either because it did not affect the cytoskeleton proteins or cell membranes, or because it did not induce any of these biochemical changes that would have led to phenotypic changes. Maybe because it emphasizes the life cycle. The cells subjected to the combined effect did not show any evident pathological changes in contrast to the control group because metformin reduced the toxicity of the oil [29, 30].
Conclusion
These outcomes stand in contrast to the cytotoxicity that the combined action's research using the MTT method revealed. This might be the case because the MTT technique required 72 hours of exposure, whereas HandE and AO/EB only required 24 hours, showing the significance of the exposure time in demonstrating cytotoxicity the combined action's efficacy and its effects on cells. Cells treated over 24 hours using the IC50 of betel oil in the AO/EB experimental were stained yellow or red, suggesting cell death. The red staining indicates that the cells died as a result of a permeability flaw that enabled EB to travel through the nuclear and plasma membrane and make contact with the nuclear material. The yellow cells, which appear to be pro-necrotic or proapoptotic. The AO stain marked the untreated, treated combination effect and treated metformin and for cell types green, indicating that their membranes still intact.
References
- Niksic H, Becic F, Koric E, Gusic I, Omeragic E, et al. Cytotoxicity screening of Thymus vulgaris L. essential oil in brine shrimp nauplii and cancer cell lines. Sci Rep. 2021;11:13178.
- Falih SM, Al-Saray ST, Alfaris AA, Al-Ali AA. The synergistic effect of eucalyptus oil and retinoic acid on human esophagus cancer cell line SK-GT-4. Egypt J Med Hum Genet. 2022;23:70.
- Zughaibi TA, Suhail M, Tarique M, Tabrez S. Targeting PI3K/Akt/mTOR pathway by different flavonoids: A cancer chemopreventive approach. Int J Mol Sci. 2021;22:12455.
- Lei J, Wang Q, Li G, Li Y, Zhang P. β-Caryophyllene from Chilli Pepper Inhibits the Proliferation of Non-Small Cell Lung Cancer Cells by Affecting miR-659-3p-Targeted Sphingosine Kinase 1 (SphK1). Int J Gen Med. 2021:9599-613.
- Mokhtari RB, Homayouni TS, Baluch N, Morgatskaya E, Kumar S. Combination therapy in combating cancer. Oncotarget. 2017;8:38022.
- Eltayeb NM, Al-Amin M, Yousif AM, Balakrishnan V, Salhimi SM. extract downregulates the expression profile of motility-related genes in highly invasive human breast cancer cell line MDA-MB-231. Biologia. 2021;76:1017-32.
- Al-Shammari AM, Al-Esmaeel WN, Al Ali AA, Hassan AA, Ahmed AA. Enhancement of oncolytic activity of Newcastle disease virus through combination with retinoic acid against digestive system malignancies. Inmolecular Ther. 2019.
- Freshney RI. Culture of animal cells: a manual of basic technique and specialized applications. John Wiley Sons. 2015.
- Tallarida RJ. Quantitative methods for assessing drug synergism. Genes cancer. 2011;2:1003-1008.
- Ould-Moussa N, Safi M, Guedeau-Boudeville MA, Montero D, Conjeaud H, et al. In vitro toxicity of nanoceria: effect of coating and stability in biofluids. Nanotoxicology. 2014;8:799-811.
- Liu K, Liu PC, Liu R, Wu X. Dual AO/EB staining to detect apoptosis in osteosarcoma cells compared with flow cytometry. Med sci monit basic res. 2015;21:15.
- Haque MU, Ferdiousi N, Sajon SR. Anticancer agents derived from plant and dietary sources: a review. Int J Pharmacogn. 2016;32:55-66.
- Al-Harrasi A, Bhatia S, Kabir MT, Behl T, Kaushik D, et al. Anticancer Properties of Essential Oils. InRole of Essential Oils in the Management of COVID-19 2022. CRC Press.
- Falih, S. M., Al-Saray, S. T., Alfaris, A. A., and Al-Ali, A. A. The synergistic effect of eucalyptus oil and retinoic acid on human esophagus cancer cell line SK-GT-4. Egypt J Med Hum Genet. 23:70.
- Al-Habeeb FF, Al AA. Evaluation of The Anti-Cancer Efficiency of Lavender Oil and Newcastle Disease Virus (NDV) Through Induction of Apoptosis. J. Popul Ther Clin Pharmacol. 2023;30:391-406.
- Estanislao Gómez CC, Aquino Carreño A, Pérez Ishiwara DG, San Martín Martínez E, Morales López J, et al. Radlk essential oil induces apoptosis of the MDA-MB-231 breast cancer cell line. BMC Complement Altern Med. 2016;16:1.
- Yang C, Chen H, Chen H, Zhong B, Luo X. Antioxidant and anticancer activities of essential oil from Gannan navel orange peel. Molecules. 2017;22:1391.
- Das S, Parida R, Sandeep IS, Nayak S, Mohanty S. Biotechnological intervention in betelvine (Piper betle L.): A review on recent advances and future prospects. Asian Pac J Trop Med. 2016;9:938-946.
- McLaughlin JL, Hostettmann K. Methods in plant biochemistry. Assays for Bioactivity. 1991;6:1-33.
- Shen Z, Xue D, Wang K, Zhang F, Shi J, et al. Metformin exerts an antitumor effect by inhibiting bladder cancer cell migration and growth, and promoting apoptosis through the PI3K/AKT/mTOR pathway. BMC urology. 2022;22:1.
- Rasool A, Mahmood IH. Evaluation of Cytotoxic Effect of Metformin on a Variety of Cancer Cell Lines.
- Cao N, Lu Y, Liu J, Cai F, Xu H, et al. Metformin synergistically enhanced the antitumor activity of celecoxib in human non-small cell lung cancer cells. Front Pharmacol. 2020;11:1094.
- Ko E, Baek S, Kim J, Park D, Lee Y. Antitumor activity of combination therapy with metformin and trametinib in non-small cell lung cancer cells. Dev Reprod. 2020;24:113.
- Xia C, Liu C, He Z, Cai Y, Chen J. Metformin inhibits cervical cancer cell proliferation by modulating PI3K/Akt-induced major histocompatibility complex class I-related chain A gene expression. J Exp Clin Cancer Res. 2020;39:1-2.
- Warburg O. On the origin of cancer cells. Science. 1956;123:309-314.
- Boukhatem MN, Sudha T, Darwish NH, Chader H, Belkadi A, et al. A new eucalyptol-rich lavender essential oil: Emerging potential for therapy against inflammation and cancer. Molecules. 2020;25:3671.
- Girola N, Figueiredo CR, Farias CF, Azevedo RA, Ferreira AK, et al. Camphene isolated from essential oil of Piper cernuum (Piperaceae) induces intrinsic apoptosis in melanoma cells and displays antitumor activity in vivo. Biochem Biophys Res Commun. 2015;467:928-934.
- Pan Q, Yang GL, Yang JH, Lin SL, Liu N, et al. Metformin can block precancerous progression to invasive tumors of bladder through inhibiting STAT3-mediated signaling pathways. J Exp Clin Cancer Res. 2015;34:1-2.
- Ibrahim A, Khalil IA, El-Sherbiny IM. Development and evaluation of core-shell nanocarrier system for enhancing the cytotoxicity of doxorubicin/metformin combination against breast cancer cell line. J Pharm Sci. 2022;111:2581-2591.
- Liu Q, Tong D, Liu G, Xu J, Do K et al. Metformin reverses prostate cancer resistance to enzalutamide by targeting TGF-β1/STAT3 axis-regulated EMT. Cell death dis. 2017;8:3007.
