Research Article - Onkologia i Radioterapia ( 2023) Volume 17, Issue 2
CT staging of oral cavity malignancy with histopathological correlation
Beena Devi Agarwal1*, Soumya Ranjan Nayak1 and Satya Sundar Mohapatra22Professor, Department of Radiodiagnosis, Institute of Medical Sciences and Sum Hospital, Siksha ‘O’ Anusandhan Deemed to be University, Odisha, India
Beena Devi Agarwal, Assistant Professor, Department of Radio-diagnosis, Institute of Medical Sciences and Sum Hospital, Siksha ‘O’ Anusandhan Deemed to be University, Bhubaneswar, Odisha, India, Email: beena.bbsr@gmail.com
Received: 19-Feb-2023, Manuscript No. OAR-23-89648; Accepted: 10-Mar-2023, Pre QC No. OAR-23-89648 (PQ); Editor assigned: 21-Feb-2023, Pre QC No. OAR-23-89648 (PQ); Reviewed: 28-Feb-2023, QC No. OAR-23-89648 (Q); Revised: 07-Mar-2023, Manuscript No. OAR-23-89648 (R); Published: 13-Mar-2023
Abstract
Background: Oral cavity malignancy is the third most common tumour in India. While clinical examination allows direct lesion visualization and cervical lymph node evaluation, a deeper extension of primary disease and its relation to adjacent structures (which help in deciding resectability), sub-centimetre cervical lymph node evaluation is limited by clinical examination. Cross-section imaging has become the mainstay in the pre-treatment evaluation of oral cavity malignancy for appropriate management and prognostication.
Objective: Assess the role of multi-detector CT in T & N staging of squamous cell carcinoma of oral cavity subsites and correlate the CT staging with histopathological staging.
Materials and Methods: This prospective study was carried out in a tertiary care hospital. Patients with biopsy proven squamous cell carcinoma of oral cavity were evaluated with multi-detector computed tomography and appropriate gross histopathological examination. Puffed cheek manoeuvre was used to detect buccal mucosa and GBS lesions.
Results: The study focuses on CT staging (T & N stage) of various subsites of the oral cavity malignancy with histopathological correlation. The most common subsites in our study was buccal mucosa i.e., 26 out of 75 patients. RMT, alveolus, and GBS were the second most common subsites. CT scan of the oral cavity provides a better assessment of loco regional spread especially cortical bone involvement and morphological analysis of cervical lymph nodes.
Conclusion: The sensitivity, specificity, positive predictive value, negative predictive value and accuracy of CT in staging oral cavity squamous cell carcinoma is statistically significant compared to the gold standard, i.e. post-op histopathological staging. CT was most sensitive in detecting maxillary sinus infiltration and bone infiltration.
https://blogum.blogaaja.fi/
https://blogum-1.jimdosite.com/
https://blogummm.edublogs.org/
https://blogummm.websites.co.in/
https://blogum18.wordpress.com/
https://benim-blogum.jigsy.com/
https://fuiegs-symbeaurds-build.yolasite.com/
https://blogum-03.webselfsite.net/
https://blogummm.mystrikingly.com/
https://blogum.splashthat.com/
https://blogum3.webnode.com.tr/
https://blogum.odoo.com/
https://blogum.creatorlink.net/
https://whiteseotr1-s-site.thinkific.com/enrollments
https://blogum.estranky.cz/
https://653ba4fbb538c.site123.me/
https://blogum12m.blogspot.com/
https://blogum.hashnode.dev/
https://whiteseoturkey1.wixsite.com/blogum
https://sites.google.com/view/blogummm/
https://codepen.io/blogum
https://blogumm.livejournal.com/
https://wakelet.com/@blogum82816
https://www.homify.com/users/9538383/blogum
https://lessons.drawspace.com/profile/323613/blogum
https://my.desktopnexus.com/blogum/
https://writeupcafe.com/profile/BLOGUM/
https://www.pearltrees.com/blogum
https://www.easyfie.com/blogum
https://pharmahub.org/members/27615/profile
https://www.zupyak.com/u/blogum/posts
https://www.metroflog.co/blogum
https://www.fuzia.com/fz/blogum-blogum
https://tr.pinterest.com/blogum12/
https://my.getjealous.com/blogum
https://micro.blog/blogum
https://www.tumblr.com/blogummm
https://hub.docker.com/u/blogum
https://fire.blogfree.net/?act=Profile&MID=1342323
https://blogum.pixnet.net/blog
https://www.threadless.com/@blogum/activity
https://blogum.neocities.org/
https://blogum12.amebaownd.com/
https://teletype.in/@blogum
https://ubl.xml.org/users/blogum
https://educatorpages.com/site/blogum/
https://blogum.onlc.fr/
Keywords
CT staging, malignancy, histopathological correlation
Introduction
Oral cavity malignancy is the third most common tumour in India, accounting for 30% of all cancers and 40% of all cancerrelated deaths in India. Squamous cell carcinoma accounts for the majority of oral cavity malignancies (>90%) with the ageadjusted incidence in India being 20 per 100,000 population and worldwide age-adjusted rate (incidence) of 6.3% in men and 3.2% in women [1-4]. Males are affected more often th an females because of increased tobacco and alcohol abuse in most countries. Tobacco chewing, alcohol consumption, and human papillomavirus infection are identified as causative risk factors associated with squamous cell carcinoma [4]. The common sites for oral squamous cell cancer include the lower gingivobuccal complex comprising of buccal mucosa, gingivobuccal sulcus, lower gingiva and retro molar trigone. The patterns of spread of malignancy vary with the primary site of malignancy, as described [5-7], For Tongue- Intrinsic and extrinsic muscles, invasion of neurovascular bundle, floor of the mouth and mandible; retro molar trigone- Mandible, PNS inferior alveolar nerve/ V3, pterygomandibular raphebuccinators and superior constrictor muscle; Lip (Upper and lower)-Orbicularis oris muscle, skin, buccal mucosa, mandible/maxilla; Floor of mouth- Submucosal spread, invasion of lingual neurovascular bundle/extrinsic tongue muscle, mylohyoid and hyoglossus muscles, mandible; Soft and hard Palate- Bony erosion of hard palate, PNS greater palatine and lesser palatine nerves to PPF; Buccal mucosa/ gingiva- Submucosal spread, erosion of maxilla/mandible. Due to extensive loco regional spread, the resectability or advanced treatment depends on stage of the malignancy. So, staging of these tumours plays a vital role in management. Early cancers (stage I, II) are treated with a single modality, either surgery or radiotherapy. In contrast, advanced stages (stage III, stage IV) are treated with surgery along with chemo radiotherapy [8,9].
Nodal metastases also significantly impact treatment and prognosis of head and neck cancer. The rate of nodal involvement in the SCC of the oral cavity indicates the aggressive nature of the primary tumour and is an important prognosticator [10-13]. Solitary nodal involvement decreases the survival rate by 50% of the expected survival rate than those without any nodal metastases [12-16]. Imaging can decide if the tumour is resectable and also help plan the precise extent of resection [1]. Improvements in surgical techniques and routine use of postoperative radiation or chemo radiationtherapy have resulted in improved survival statistics over the past decade [17]. CT is the first imaging modality used for evaluation of any oral cavity cancers as it provides a better assessment of cortical bone involvement, nodal involvement and should be performed with IV contrast to increase tumour conspicuity in soft tissues unless contraindicated [1,6,7].
Materials and Methods
This prospective study was carried out in our department over a period of two years after getting approval from medical ethics committee of our institute. Patients with biopsy proven squamous cell carcinoma of oral cavity were evaluated with multi-detector computed tomography (16 slice Phillips CT scanner) and appropriate gross histopathological examination. Adult patients with pathologically proven squamous cell carcinoma of oral cavity subsites referred to our department were included in study. Patients with T4b stage and who did not give informed consent to participate in the study were excluded from our study.
Statistical analysis
Descriptive and inferential statistical analysis was carried out in the present study. Results on continuous measurements were presented on Mean ± SD (Min-Max) and results on categorical measures were presented in number (%). Significance was assessed at 5% level of significance. Chi-square/Fisher Exact test was used to find the significance of study parameters on a categorical scale between two or more groups in non-parametric setting for qualitative data analysis and the remaining others are treated as the explanatory variables/factors
Results
A total of 75 patients were enrolled in the study. The age of the patients ranged from 19 years to 81 years, with the maximum number of patients being 51 years-60 years (38.7%). The mean age was 54 years. Gender distribution in our study was nearly equal, with the male: female ratio being 0.9:1 (38female and 37 male patients). The most common subsites in our study was buccal mucosa i.e., 26 out of 75 patients. RMT, alveolus, and GBS were the second most common subsites (Table 1).
Tab. 1. Primary oral cavity malignancy subsites distribution
| Primary Subsites | Total |
|---|---|
| BM | 26 (34.7%) |
| RMT | 9 (12%) |
| Tongue | 8 (10.7%) |
| Upper or lower alveolus | 9 (12%) |
| Hard palate | 4 (5.3%) |
| FOM | 4 (5.3%) |
| Lower lip/upper lip | 6 (8%) |
| GBS | 9 (12%) |
| Total | 75 (100%) |
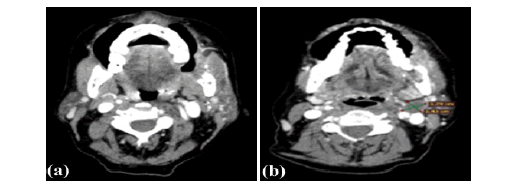
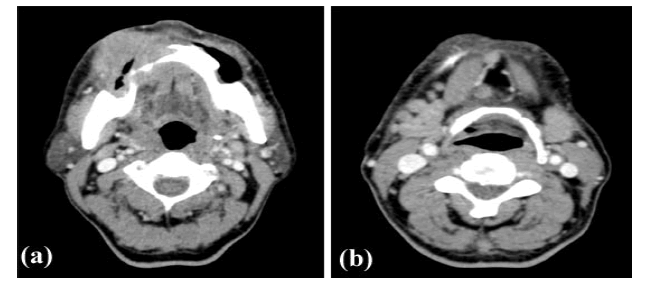
Size was measured by putting callipers along greatest dimension and was staged (according to 8 th edition TNM) T1 for size <2 cm with depth of invasion less than equal to 5 mm, T2 for size 2 cm-4 cm or less than equal to 2 cm with depth of invasion 5 mm-10 mm and T3 for size >4 cm and depth of invasion less than equal to 10 mm or any tumour with depth of invasion more than equal to 10 mm, T4a for size >4 cm with depth of invasion more than 10 mm or tumour with adjacent structures involvement (bone, maxillary sinus, skin) (Figure 1a, 2a).
Figure 1: Heterogeneously enhancing lesion in left buccal mucosa, RMT with mandibular erosion and ipsilateral cervical level II lymphadenopathy T4a N1
Figure 2: Heterogenously enhancing mass involving right gingivibuccal sulcus with ipsilateral hemimandible erosion and multiple small cervical level Ia, right level Ib lymphnodes. Right inferior GBS SCC T4a N2b
According to radiological staging using contrast CT, in our study 44 out of 75 patients fell under T4a stage, next most common T stage involved was T2 i.e. 21 out of 75 patients. T1 stage was least common T stage in our study group. Most of the patients with T4a stage showed bone infiltration both radiologically and pathologically, only few cases showed maxillary sinus infiltration and skin infiltration (Table 2).
Tab. 2. Radiological T stage distribution of patients studied.
| Radiological T stage | Total |
|---|---|
| T1 | 3 (4%) |
| T2 | 21 (28%) |
| T3 | 7 (9.3%) |
| T4a | 44 (58.7%) |
| Only Bone infiltration | 13 (17.3%) |
| Muscle Infiltration | 7 (9.3%) |
| Maxillary Sinus infiltration | 3 (4%) |
| Skin infiltration | 4 (5.3%) |
| Bone and muscle infiltration | 14 (18.7%) |
| Bone, Muscle and skin infiltration | 2 (2.7%) |
| Bone and Skin infiltration | 1 (1.3%) |
| Total | 44 (58.7%) |
According to TNM staging (8th edition AJCC), N0- no regional nodal metastasis, N1- metastasis in single ipsilateral node measuring less than equal to 3 cm without extra nodal extension (Figure 1b), N2a- metastasis in single ipsilateral node measuring 3 cm-6 cm without extra nodal extension or metastasis in single ipsilateral node measuring less than equal to 3 cm with extra nodal extension (Figure 2b), N2b- metastasis in multiple ipsilateral nodes measuring less than equal to 6 cm without extra nodal extension, N2c-metastasis in bilateral or contralateral nodes measuring less than equal to 6 cm without extra nodal extension, N3- node with size more than 6 cm or metastasis in single ipsilateral node with size more than 3 cm and extra nodal extension or multiple ipsilateral, contralateral or bilateral nodes with extra nodal extension or single contralateral node with extra nodal extension. In our study, most patients fell under N2b stage i.e. 34 out of 75, followed by N0 stage i.e. 19 out of 75, least being N3 stage i.e. 2 out of 75 patients (Table 3).
Tab. 3. Radiological N stage distribution of patients studied
| Radiological N stage | Total |
|---|---|
| N0 | 19 (25.3%) |
| N1 | 12 (16%) |
| N2a | 2 (2.7%) |
| N2b | 34 (45.3%) |
| N2c | 6 (8%) |
| N3 | 2(2.7%) |
| Total | 75 (100%) |
most of the patients showed only bone infiltration. Least common T stage was T1. Out of T4a stage, most patients showed only bone infiltration (Table 4).
Tab. 4. Pathological T stage distribution of patients studied
| Pathological T stage | Total |
|---|---|
| T1 | 3 (4%) |
| T2 | 23 (30.7%) |
| T3 | 7 (9.3%) |
| T4a | 42 (56%) |
| Only Bone infiltration | 26 (34.7%) |
| Muscle Infiltration | 4 (5.3%) |
| Maxillary Sinus infiltration | 3 (4%) |
| Skin infiltration | 0 (0%) |
| Bone and muscle infiltration | 5 (6.7%) |
| Bone, Muscle and skin infiltration | 0 (0%) |
| Bone and Skin infiltration | 4 (5.3%) |
| Total | 42 (56%) |
Pathologically, most patients fell under N2b stage (38.7%) while 29.3% patients showed no node involvement (Table 5).
Tab. 5. Pathological N stage distribution of patients studied
| Pathological N stage | Total |
|---|---|
| N0 | 22(29.3%) |
| N1 | 16(21.3%) |
| N2a | 2(2.7%) |
| N2b | 29(38.7%) |
| N2c | 4(5.3%) |
| N3 | 2(2.7%) |
| Total | 75(100%) |
The sensitivity, specificity, PPV, NPV and accuracy for T1, T2, T3 and T4a stages were measured. The P value was less than 0.001 (Table 6).
Tab. 6. Correlation of radiological and pathological findings on tumour staging
| Tumour staging | Observation | Correlation | |||||||||
|---|---|---|---|---|---|---|---|---|---|---|---|
| TP | FP | FN | TN | Total | Se | Sp | PPV | NPV | Accuracy | P value | |
| T1 | 3 | 0 | 0 | 72 | 75 | 100 | 100 | 100 | 100 | 100 | <0.001** |
| T2 | 15 | 6 | 8 | 46 | 75 | 65.22 | 88.46 | 71.43 | 85.13 | 81.33 | <0.001** |
| T3 | 6 | 1 | 1 | 67 | 75 | 85.71 | 98.53 | 85.71 | 98.53 | 97.33 | <0.001** |
| T4a | 35 | 9 | 7 | 24 | 75 | 83.33 | 72.73 | 79.55 | 77.42 | 78.67 | <0.001** |
Most of the patients with T4a stage showed bone infiltration both radiologically and pathologically followed by muscle infiltration. Only few cases showed maxillary sinus infiltration and skin infiltration. In T4a patients with bone infiltration, majority showed only mandible infiltration. The sensitivity and specificity, PPV, NPV and accuracy for bone infiltration, muscle infiltration, maxillary sinus infiltration and skin infiltration are as follows (Table 7).
Tab. 7. Correlation of radiological and pathological findings on T4a staging
| T4a staging | Observation | Correlation | |||||||||
|---|---|---|---|---|---|---|---|---|---|---|---|
| TP | FP | FN | TN | Total | Se | Sp | PPV | NPV | Accuracy | P value | |
| Bone infiltration | 27 | 3 | 8 | 37 | 75 | 77.14 | 92.5 | 90 | 82.22 | 85.33 | <0.001** |
| Muscle infiltration | 5 | 18 | 3 | 49 | 75 | 62.5 | 73.13 | 21.74 | 94.23 | 72 | 0.038* |
| Maxillary sinus infiltration | 3 | 0 | 0 | 72 | 75 | 100 | 100 | 100 | 100 | 100 | <0.001** |
| Skin infiltration | 3 | 4 | 0 | 68 | 75 | 100 | 94.4 | 42.9 | 100 | 94.7 | <0.001** |
Radiologically, 56 patients showed positive nodes out of which 49 were true positive and 7 were true negative. The sensitivity, specificity, PPV, NPV, accuracy of CT for positive nodes was measured and the P value <0.001 (Table 8).
Tab. 8. Radiological node in relation to pathological node of patients studied
| Radiological Node | Pathological Node | Total | ||
|---|---|---|---|---|
| Negative Node | Positive Node | |||
| Negative Nodes | 15 (68.2%) | 4 (7.5%) | 19 (25.3%) | |
| Positive Nodes | 7 (31.8%) | 49 (92.5%) | 56 (74.7%) | |
| Total | 22 (100%) | 53 (100%) | 75 (100%) | |
| Correlation of radiological vs pathological for Positive node | P value | |||
| Sensitivity % | 92.45 | <0.001** | ||
| Specificity % | 68.18 | <0.001** | ||
| PPV % | 87.5 | <0.001** | ||
| NPV % | 78.95 | <0.001** | ||
| Accuracy % | 85.33 | <0.001** | ||
Discussions
In this prospective study, 75 adult patients were enrolled after taking written informed consent. Patients referred for CT scan following pathological diagnosis of oral cavity squamous cell carcinoma were included in the study. CT staging was done using TNM staging and correlated with post op histopathological staging as it is considered gold standard for staging [18]. Out of all the 75 patients, 26 patients were found to have buccal mucosa as their primary subsites constituting the most common subsite in oral cavity malignancy, followed by GBS, RMT and alveolus. Of all the T stages, most patients fell under T4a stage both radiologically (44 cases) and pathologically (42 cases). Of all the N stages, most patients fell under N2b stage pathologically. With respect to gender distribution, the number of males and females was 37 and 38 respectively, with a male: female ratio of 0.9:1 suggesting nearly equal gender distribution of oral cavity malignancy. Most of the patients fell under the age group of 51-60. The number of true positive cases for different T stages on CT was 58 in the present study, these comprised of 3 T1, 15 T2, 6 T3 and 35 T4 stage cases. The detection percentageof different T stages on CT was statistically significan-t and correlated well with a prospective study done by Wiener et. al. [17]. The sensitivity, specificity, PPV, NPV and accuracy of CT for bone infiltration in present study was 77%, 92.5%, 90%, 82%, 85% respectively which was comparable to the study conducted by Wiener et. al., Uribe et. al. and Kushraj et. al. [17,19,20].
The sensitivity of CT for positive nodes was 92% in present study which was comparable to a study done by Pandeshwar et. al. (92%) and Saafan et. al. (83%) [9,21]. The specificity in present study was 68% which was comparable to a study done by Wiener et. al. (75.7%) [17]. PPV in present study was 87% which was comparable to studies done by Pandeshwar et. al. (85%), Saafan et. al. (95%) and Anand et. al. (94.5%) [9,21,22]. NPV in present study was 79% which was comparable to studies done by Wiener et. al. (86%), Saafan et. al. (68%) and Anand et. al. (71%) [17,21,22]. Accuracy in present study was 85% which was comparable to studies done by Pandeshwar et. al., Wiener et. al., Saafan et. al. and Anand et. al. [9,17,21,22].
Limitations
As our institute is a tertiary hospital, most of the cases referred were locally advanced malignant lesions i.e., T4a stage. A comparative study of other T4a parameters i.e. skin infiltration and maxillary sinus infiltration, was not done as no reference article was available. The usefulness of CT in the evaluation of the T4b stage was not possible as most of them are managed palliative with chemo radiation, so post-op histopathological findings were unavailable for comparison. Squamous cell carcinoma is the most common pathological type of malignancy in oral cavity, so to obtain homogenous results, patients with this type of oral cavity malignancy was only included in the study. M staging is not considered in the present study in view of the rarity of metastatic disease which outweighs radiation exposure from whole-body CT.
Conclusion
CT is a useful non-invasive cross-section imaging tool designed to enable T, N staging of squamous cell carcinoma of different subsite of oral cavity. Contrast administration with puffed cheek manoeuvre increases soft tissue delineation along with proper evaluation of gingivobuccal sulcus and buccal mucosa. Our study shows that sensitivity, specificity, positive predictive value, negative predictive value, and accuracy of CT in staging oral cavity squamous cell carcinoma is statistically significant compared to the gold standard, i.e. post-op histopathological staging. Among all the oral cavity subsites, buccal mucosa was found to be the most common site of malignancy followed by RMT. Out of all T4a parameters, CT was most sensitive in detecting skin infiltration, maxillary sinus infiltration, and bone infiltration. CT was found to be only moderately significant in detecting muscle infiltration. Commonest N stage was found to be N2b. For nodal staging, CT showed significant sensitivity, specificity, po sitive predictive value, negative predictive value, and accuracy compared to goldstandard histopathological staging.
Financial Support and Sponsorship
Nil.
Conflicts of Interest
There are no conflicts of interest.
References
- Arya S, Chaukar D, Pai P. Imaging in oral cancers. Indian J Radiol Imaging. 2012; 22:195-208.
- Chong V. Oral cavity cancer: Monday 3 October 2005, 14: 00–16: 00. Cancer imaging. 2005;5: S49.
- Sankaranarayanan R, Masuyer E, Swaminathan R, Ferlay J, Whelan S. Head and neck cancer: a global perspective on epidemiology and prognosis. Anticancer res. 1998;18:4779-4786.
- Som PM, Curtin HD. Head and Neck Imaging E-Book. Elsevier Health Sci. 2011.
- Misra S, Chaturvedi A, Misra NC. Management of gingivobuccal complex cancer. Ann R Coll Surg Engl. 2008;90:546-553.
- Law CP, Chandra RV, Hoang JK, Phal PM. Imaging the oral cavity: key concepts for the radiologist. Br J Radiol. 2011; 84:944-957.
- Genden EM, Ferlito A, Silver CE, Takes RP, Suárez C, et. al.. Contemporary management of cancer of the oral cavity. Eur Arch Oto-Rhino-Laryngol. 2010; 267:1001-17. [Google Scholar] [CrossRef]
- Wolff KD, Follmann M, Nast A. The diagnosis and treatment of oral cavity cancer. Dtsch Arztebl Int. 2012;109:829.
- Pandeshwar P, Jayanthi K, Raghuram P. Pre-operative contrast enhanced computer tomographic evaluation of cervical nodal metastatic disease in oral squamous cell carcinoma. Indian J Cancer. 2013; 50:310-315.
- van den Brekel MW, Castelijns JA, Snow GB. Diagnostic evaluation of the neck. Otolaryngol. Clin N Am. 1998; 31:601-620.
- Mancuso AA. Cervical lymph node metastases: oncologic imaging and diagnosis. Int J Radiat Oncol Biol Phys. 1984;10:411-423.
- Mohan M, Paul G, Thomas S, Jaber M. Evaluation of neck node metastasis from oral cancer in an Indian population: A comparative pilot study. Ibnosina J Med Biomed Sci. 2010;2:14-23.
- Close LG, Merkel M, Vuitch MF, Reisch J, Schaefer SD. Computed tomographic evaluation of regional lymph node involvement in cancer of the oral cavity and oropharynx. Head neck. 1989; 11:309-317.
- Kowalski LP, Medina JE. Nodal metastases: predictive factors. Otolaryngol Clin N Am. 1998;31:621-637.
- Wenzel S, Sagowski C, Kehrl W, Metternich FU. The prognostic impact of metastatic pattern of lymph nodes in patients with oral and oropharyngeal squamous cell carcinomas. Eur Arch Oto-Rhino-Laryngol Head Neck. 2004; 261:270-275.
- Montero PH, Patel SG. Surg Oncol Clin N Am Cancer oral cavity. 2015; 24:491.
- Wiener E, Pautke C, Link TM, Neff A, Kolk A. Comparison of 16-slice MSCT and MRI in the assessment of squamous cell carcinoma of the oral cavity. Eur J Radiol. 2006; 58:113-118.
- Zanoni DK, Patel SG, Shah JP. Changes in the 8th edition of the American Joint Committee on Cancer (AJCC) staging of head and neck cancer: rationale and implications. Curr Oncol Rep. 2019;21:1-7.
- Uribe S, Rojas LA, Rosas CF. Accuracy of imaging methods for detection of bone tissue invasion in patients with oral squamous cell carcinoma. Dentomaxillofacial Radiol. 2013; 42:20120346.
- Kushraj T, Chatra L, Shenai P, Rao PK. Bone invasion in oral cancer patients: A comparison between Orthopantamograph, conventional computed tomography, and single positron emission computed tomography. J Cancer Res Ther. 2011; 7:438-441.
- Saafan ME, Elguindy AS, Abdel-Aziz MF, Abdel-Rahman Younes A, et. al.. Assessment of cervical lymph nodes in squamous cell carcinoma of the head and neck. Surgery Curr Res. 2013; 3:2161-1076.
- Anand N, Chaudhary N, Mittal MK, Prasad R. Comparison of the efficacy of clinical examination, ultrasound neck and computed tomography in detection and staging of cervical lymph node metastasis in head and neck cancers. Indian J Otolaryngol Head Neck Surg. 2007;59:19-23.


