Research Article - Onkologia i Radioterapia ( 2023) Volume 17, Issue 10
Clinical target volume to planning target volume margin assessment for different radiotherapy treatment sites based on the patient set-up errors using electronic portal image device
Mohamed Elsharkawy1*, Yasser Rashed1, Nasser Abdelbary2, Abd El-Azim A. Hussein3 and A. El-Sersy42Faculty of Medicine, Clinical Oncology and Nuclear Medicine Department, Menoufia University, Shibin El-Koom, Egypt
3Faculty of Science, Physics Department, Menoufia University, Shibin El-Koom, Egypt
4National Institute for Standards, NIS, Egypt
Mohamed Elsharkawy, Faculty of Medicine, Clinical Oncology and Nuclear Medicine Department, Medical Physics Unit, Menoufia University, Shibin ElKoom, Egypt, Email: bbcsdpub@gmail.com
Received: 05-Sep-2023, Manuscript No. OAR-23-112758; Accepted: 10-Oct-2023, Pre QC No. OAR-23-112758 (PQ); Editor assigned: 07-Sep-2023, Pre QC No. OAR-23-112758 (PQ); Reviewed: 30-Sep-2023, QC No. OAR-23-112758 (Q); Revised: 07-Oct-2023, Manuscript No. OAR-23-112758 (R); Published: 14-Jul-2023
Abstract
Purpose: The purpose of this study was to calculate the Clinical Target Volume (CTV) to Planning Target Volume (PTV) margin as a result of patients’ setup errors of different treatment sites using Electronic Portal Imaging Device (EPID). Methods: Brain, head and neck, breast, lung, bladder, rectum, and prostate were each represented by 30 individuals in this research, for a total of 210 patients. During radiation treatment, set-up errors were measured and collected. The necessary facts were collected to determine the optimal margin for each location to transition from CTV to PTV. Results: The setup errors of thirty brain patients varied between 0.0 and 5.0 mm, whereas those of thirty head and neck patients ranged between 0.0 and 6.0 mm. Setup errors ranged from 0.0 mm to 9.0 mm for thirty breast patients and thirty lung patients. Thirty individuals' bladder diameters fell between 0.0 mm and 7.0 mm. For thirty individuals with rectum measurements between 0.0 and 8.0 mm and thirty patients with prostate measurements between 0.0 mm and 9.0 mm. CTV to PTV ratios for Brain are 3.0 mm, Head and Neck are 3.7 mm, Breast is 5.1 mm, Lung is 6.5 mm, Bladder is 3.5 mm, Rectum is 4.1 mm, and Prostate is 4.3 mm. Conclusion: The usage of EPID for patient setup verification is an effective method. The setup errors depend on the location of the tumour, therefore it is crucial to determine the right CTV-to-PTV margin. Our study's computed margins correspond to those that have been published.
Keywords
patient positioning verification; Patient set-up error; CTV-toPTV. margin
Introduction
Radiotherapy is one of the most essential therapies used to treat malignant tumours. In radiation therapy, a cancer patient receives a dose of ionising radiation prescribed by the radiation oncologist, which is administered by directing radiation beams from outside the body, External Beam Radiotherapy (EBRT), to an area specified by the radiation oncologist by drawing the periphery of the treatment volume, Planning Target Volume (PTV) [1-4]. The radiation fields are intended to treat the tumour depending on the size and form of the PTV, delivering the recommended dosage to the PTV while protecting healthy tissue from harm caused by high ionising radiation doses. The success of the radiation therapy is dependent on the precision of the PTV definition. Numerous variables affect the precision of radiation treatment administration and the targeted dose. The expertise and knowledge of the radiation oncologist to determine the target to be treated, the quality of the many imaging modalities employed, the internal involuntary organ movements, and the geometrical correctness during the treatment are examples of variables that affect the radiotherapy accuracy [5, 6]. During radiation treatment delivery, the patient is prepared to place the treatment is center in the location designated by the Treatment Planning System (TPS). This location is confirmed by capturing setup verification image using the megavolt/kilovolt image modality. The acquired images are compared with the reference image, Digital Reconstructed Radiography (DRR), the verify the matching between the daily setup isocenter with the reference isocenter. The shift between the two isocenters is calculated in the three directions X (Right-Left "R-L"), Y (Superior-Inferior "S-I"), and Z by the software used to match the two images (Anterior-Posterior "A-P") [7]. There are two types of error present: systematic error and random error [8, 9]. The collected and analysed shift values for each treatment site are crucial for estimating the required margin to raise from the Clinical Target Volume (CTV) to the Planned Target Volume (PTV) to account for the uncertainty caused by inter- and intra-movements during radiation therapy [10]. In this study, the most common radiotherapy treatment sites; Brain, Head and Neck, Breast, Lung, Bladder, Rectum, and Prostate are selected to calculate the shift of five fractions during the treatment course of each patient. For each site, thirty patients were selected to calculate the shift between the two isocenters and estimate the required margin to add to CTV to create the PTV.
Methods
In this study, 210 patients were selected to analyse the setup errors that happened during radiation therapy. Each of the seven treatment locations (brain, head and neck breast, lung, and bladder) was allocated 30 participants [11].
Treatment machine
For this work, the clinical oncology and nuclear medicine department of Menoufia University's Faculty of Medicine in Egypt employed an Elekta Synergy Platform linear accelerator (linac) equipped with an amorphous silicon portal imaging device (a-Si EPID). Photon beams with energies of 6 and 10 mV and electron beams with energies of 4 meV, 9 meV, 12 meV, and 18 meV are produced by the clinical linac
Install verification imaging equipment
The a-Si EPID is positioned on a robotic arm at a SourceTo-Imager Distance (SID) of 160 cm and includes an image detector unit with an active mV detector area of 41 cm2 × 41 cm2 (about 26 cm2 × 26 cm2 at the isocenter) and a resolution of 1024 x 1024 16-bit pixels. Our version of the programme is iViewGTTM by Elekta (version R3.02). The iViewGTTM creates 2D MV planar pictures in a fraction of a second and helps to the achievement of a larger field of vision and superior field clarity. iViewGTTM also applies many adjustments to all gathered photos, including an offset correction, a gain correction, and a poor pixel map correction. When capturing EPID images with iViewGTTM, pixel values are renormalized before being exported to the database [12].
System for treatment planning
Using Monaco TPS, therapy strategies for patients were devised (Elekta AB, Stockholm, Sweden, version 5.11.02). The Monaco TPS combines Monte Carlo dose calculation accuracy with robust optimization tools to provide highquality radiotherapy treatment plans for 3D-CRT, IMRT and VMAT. Recent technological advancements have enabled rapid computation rates, allowing doctors and patients to take advantage of the Monte Carlo method's accuracy while minimizing the planning time.
Information system for radiation oncology
The MOSAIQ by Elekta radiation oncology information system was employed in this investigation. Multidisciplinary teams may use MOSAIQ, a full patient management information system, from various locations. It combines patient data from radiation oncology, particle treatment, and medical oncology into a single user interface. With MOSAIQ, you can easily access almost any linac and TPS from any manufacturer, providing unparalleled integration and the freedom to choose the patient treatment options that are best for you. A pioneer in oncology information systems globally, MOSAIQ offers scalable and reliable image, data, and workflow management for anything from the tiniest doctor's office to the most intricate provider networks.
Install imaging verification software
Other Elekta products, such as the MOSAIQ data management system and Monaco TPS, are effortlessly integrated with the iViewGT. Patient setup verification is possible with the Elekta Synergy® Platform's basic offering, iViewGT. With as little as 1 Monitor Unit (MU), the iViewGT programme can produce a high-quality picture and display it in a split second. Image quality is significantly improved by the iViewGTTM's very sensitive solid-state detector. For the best assessment, images may be shown in a number of ways, including lung and bone inversion. To make it easier to compare a picture to the reference image, it may be magnified, scaled, measured, flipped, and rotated. Images may be improved for increased image optimization using CLAHE in challenging anatomical locations. Online or offline comparisons between the reference and output images are also available. The patient's displacement is instantly visible and recorded for study after picture registration. A picture may have notes attached to it that may be saved for later use. Patient position findings may be submitted for approval, and registration may be approved with the addition of annotations.
Patients
The objective of this work quantitative and analytical research was to evaluate the irradiation setup error in RT using Utilizing the MOSAIQ and iViewGT software’s. In this research, pictures from the EPID database were examined. 210 patients made up the study's population for the purpose of verifying the radiotherapy radiation setup. For a total of 210 people, the brain, head and neck, breast, lungs, bladder, rectum, and prostate are each separated into 30 examples.
Protocol of set-up
The first three components of our verification approach for patient setup are as follows: daily verification of two orthogonal pictures, followed by a weekly evaluation for setup errors. For this research, patients with at least five setup error verifications were chosen. We chose the first three fraction times plus two set-up verification times for the next two weeks if the patient has less than fifteen fractions, as in the case of breast, lung, or brain. The patient will get five set-up verifications spaced evenly if they have between 20 and 30 fractions. Setup fields are added to the treatment plan after the creation of the plan using Monaco TPS. Two orthogonal setup fields are often added, with the closest to the target having a gantry angle of 90° or 270° and the other having a gantry angle of 0°. Reference Images (DRRs) are created using the setup fields, and the resultant information is submitted to the MOSAIQ programme. At least two verification pictures were acquired and captured using the iView programme during patient setup. The programme showed us the change in the isocenter of the setup field in three directions: vertical (A-P), lateral (R-L), and longitudinal(S-I). Using software tools to compare the obtained pictures with the reference image (DRR).
Derivation of random and systematic setup faults
Set-up errors
The set-up error (∆) when comparing an image to its matching reference, is defined as the difference between the actual and predicted location. This difference is often recorded as a shift in the isocentric position. For the lateral picture, setup error must be resolved into orthogonal directions: A-P and Superior-Inferior; for the anterior image, R-L and Superior-Inferior. Maintaining exact direction data requires the calculation of vector values.
Systematic setup errors
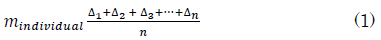
individual mean set-up error
The systematic error (mindividual) is the mean set-up error for an individual patient. It is calculated by summing the measured set-up error for each imaged fraction ((â??1+â??2+â??3…..) then dividing by the number of imaged fractions. This can be expressed by the formula
Set-up errors for the overall population
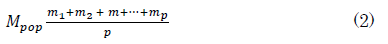
The overall mean set-up error (Mpop) is the overall mean for the analysed patient group and should ideally equal zero. Significant departures from zero indicate a frequent underlying error in this patient group that need further investigation. This statistic is a strong indicator of the efficacy of any treatment plan, despite its frequent disregard. The only difference is that the means for each patient (m1, m2, m3, etc.) are now summed and the sum is divided by the number of patients in the analysed group (P).
Population systematic error
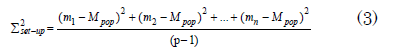
The systematic error for the population (∑set-up) Individual mean setup error standard deviation in relation to the population mean (Mpop). Equation 2's prediction of the population mean and Equation 1's prediction of the mean for each patient individually are used to compute it. The difference between these two is then added to get the result. Set-up is calculated by taking the square root of the result and dividing it by the number of patients less one.
Random set-up errors
Individual random error
In accordance with equation 1, the interactional random set-up error (σindividual) is the standard deviation of the setup errors around the corresponding mean individual value (mindividual). It is calculated by squaring the disparities between each image's setup error and mean. In order to compute each person, the final total is divided by the number of images, minus one.

Population random error
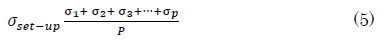
The mean of all individual random errors is the population random error (σset-up). This equation assumes that each patient will be imaged the same number of times or that any variations will not significantly affect the result
CTV-to-PTV margin assessment
This study, CTV to PTV margin is calculated using the equation
Where Σ and σ represent the total of all systematic and random error contributions, respectively. The constants '2.5' and '0.7' represent the respective contributions of the systematic and random components, which depend on variables such as the beam configuration and selected coverage probability

Results
Set-up errors
Using EPID, the positional set-up error for 210 patients was assessed. From the set-up error measurements of thirty brain tumour patients, the measured data ranged between 0.0 mm and 5.0 mm. The set-up error data for head and neck cancers ranged from 0.0 mm to 6.0 mm. thirty breast patients had set-up error readings ranging from 0.0 mm to 9.0 mm. thirty lung cancer patients had setup errors ranging from 0.0 mm to 9.0 mm, according to the data. Thirty patients with bladder cancer had set-up errors in the range of 0.0 mm to 7.0 mm, whereas thirty patients with rectum cancer had set-up errors in the range of 0.0 mm to 8.0 mm. The setup errors for thirty prostate cancer patients ranged from 0.0 mm to 9.0 mm.
Systematic set-up error
Individual mean set-up error
The most evaluated errors in radiotherapy are the systematic errors and the random errors. Systematic errors (Σ) indicate the discrepancy between the patient's position on the CT simulator and the treatment position verification picture. Random errors (σ) are related to fluctuations in patient posture from day to day.
After collecting the setup mistakes over each patient's entire treatment course, the data were examined to determine the systematic and random errors. Individual mean set-up error is one of the prerequisites for calculating. Table provides a summary of the individual mean set-up mistakes for the seven chosen treatment locations. The table provides the mean, maximum, and lowest values in three directions: Right-To-Left (R-L), Anterior-Posterior (A-P), and Superior-Inferior (S-I). The last column of the table displays the mean findings for all directions (Table 1).
Tab. 1. The mean, maximum, and lowest of the individual mean systematic error (mindividual) for seven tumour sites in various orientations, as well as the mean for all directions
| Site | Patient | Anterior field | Lateral field | Average | ||
|---|---|---|---|---|---|---|
| R-L | S-I | S-I | A-P | |||
| Brain | Averg. | 0.36 | 0.53 | 0.5 | 0.77 | 0.54 |
| Max. | 1 | 1.8 | 1.2 | 2.6 | 1.65 | |
| Min. | 0 | 0 | 0 | 0 | 0 | |
| Head and neck | Averg. | 0.95 | 1.23 | 0.99 | 1.01 | 1.05 |
| Max. | 2.4 | 2.8 | 3.6 | 2.6 | 2.85 | |
| Min. | 0.2 | 0 | 0.2 | 0 | 0.1 | |
| Breast | Averg. | 1.02 | 0.8 | 1.11 | 1.25 | 1.05 |
| Max. | 3 | 2.6 | 2.4 | 5 | 3.25 | |
| Min. | 0 | 0 | 0 | 0 | 0 | |
| Lung | Averg. | 1.65 | 2.52 | 2.35 | 2.67 | 2.3 |
| Max. | 5.8 | 7.6 | 6.2 | 5.8 | 6.35 | |
| Min. | 0.2 | 0.6 | 0 | 0.6 | 0.35 | |
| Bladder | Averg. | 1.12 | 0.86 | 0.92 | 1.48 | 1.1 |
| Max. | 5.6 | 2.2 | 2 | 4.2 | 3.5 | |
| Min. | 0 | 0.2 | 0 | 0.2 | 0.1 | |
| Rectum | Averg. | 0.99 | 1.49 | 1.15 | 1.54 | 1.29 |
| Max. | 3.2 | 3.4 | 4 | 5.6 | 4.05 | |
| Min. | 0 | 0.2 | 0.2 | 0.2 | 0.15 | |
| Prostate | Averg. | 1.05 | 1.29 | 1 | 1.67 | 1.25 |
| Max. | 3 | 4.4 | 4 | 5 | 4.1 | |
| Min. | 0 | 0 | 0 | 0 | 0 |
The average, maximum, and lowest values for thirty brain patients were 0.54 mm, 1.65 mm, and 0.00 mm, respectively. For the head and neck, 1.05 mm, 2.85 mm, and 0.10 mm are used. 1.05 mm, 3.25 mm, and 0.00 mm for breast. 2.30 mm, 6.35 mm, and 0.35 mm for lung. For the bladder, 1.10 mm, 3.50 mm, and 0.10 mm are used. 1.29 mm, 4.05 mm, and 0.15 mm for rectum. For the prostate, 1.25 mm, 4.10 mm, and 0.00 mm are used.
Overall population mean set-up error (Mpop)
Table displays the population-wide mean set-up error (Mpop) for seven chosen treatment locations. Mpop is the overall mean for the patient population examined and should ideally be equal to zero. This metric is a powerful indication of the effectiveness of any treatment strategy, although it is often neglected. The average Mpop in all directions for the brain, head and neck, breast, lung, bladder, rectum, and prostate were 0.24 mm, 0.40 mm, 0.91 mm, 0.77 mm, 0.25 mm, 0.49 mm, and 0.33 mm, respectively, as shown in (Table 2).
Tab. 2. The Overall population mean setup error (Mpop) for seven tumour sites
| Site | Anterior field | Lateral field | Average | ||
|---|---|---|---|---|---|
| R-L | S-I | S-I | A-P | ||
| Brain | -0.12 | 0.34 | 0.35 | 0.37 | 0.24 |
| Head and neck | 0.21 | 0.56 | 0.27 | 0.55 | 0.4 |
| Breast | 0.89 | 0.66 | 0.99 | 1.09 | 0.91 |
| Lung | 0.37 | 1.09 | 0.68 | 0.92 | 0.77 |
| Bladder | 0.28 | 0.13 | 0.12 | 0.46 | 0.25 |
| Rectum | 0.27 | 0.58 | 0.27 | 0.83 | 0.49 |
| Prostate | 0.47 | 0.35 | 0.39 | 0.11 | 0.33 |
Square of population systematic set-up error (Σ2set-up)
To calculate Σset-up, we must use the equation 3 to calculate the square of Σset-up. After calculating Σ2 set-up, the Σset-up is calculated by taking the square root of Σ2 set-up. Table illustrates the average values of thirty reading of Σ2set-up for each site for all selected treatment sites. The average Σ2set-up of brain, head and neck, breast, lung, bladder, rectum, and prostate were 0.54-mm, 0.94- mm, 1.42 mm, 3.29 mm, 0.81 mm, 1.23 mm, and 1.13 mm respectively (Table 3).
Tab. 3. The Square of population systematic set-up errors for seven tumour sites
| Treatment Site |
|
Anterior field | Lateral field | Average (mm) | ||
|---|---|---|---|---|---|---|
| R-L (mm) | S-I (mm) | S-I (mm) |
A-P (mm) |
|||
| Brain |  |
0.53 | 0.36 | 0.75 | 0.5 | 0.54 |
| Head and neck |  |
0.39 | 1.04 | 1.23 | 1.08 | 0.94 |
| Breast |  |
2.07 | 1.36 | 1.09 | 1.17 | 1.42 |
| Lung |  |
2.21 | 3.46 | 3.9 | 3.58 | 3.29 |
| Bladder |  |
0.75 | 0.35 | 0.91 | 1.24 | 0.81 |
| Rectum |  |
1.05 | 1.04 | 1.17 | 1.65 | 1.23 |
| Prostate |  |
1.05 | 1.12 | 1.39 | 0.97 | 1.13 |
Population systematic set-up error (Σset-up)
Table shows the values of Σset-up for all sites. Brain, head and neck, breast, lung, bladder, rectum, and prostate had average values of 0.73 mm, 0.95 mm, 1.19 mm, 1.81 mm, 0.88 mm, 1.11 mm, and 1.06 mm, respectively (Table 4).
Tab. 4. The Population systematic set-up errors for seven tumour sites
| Treatment Site |
|
Anterior field | Lateral field | Average (mm) | ||
|---|---|---|---|---|---|---|
| R-L (mm) | S-I (mm) | S-I (mm) |
A-P (mm) |
|||
| Brain |  |
0.73 | 0.6 | 0.87 | 0.71 | 0.73 |
| Head and neck |  |
0.63 | 1.02 | 1.11 | 1.04 | 0.95 |
| Breast |  |
1.44 | 1.17 | 1.05 | 1.08 | 1.19 |
| Lung |  |
1.49 | 1.86 | 1.98 | 1.89 | 1.81 |
| Bladder |  |
0.87 | 0.59 | 0.95 | 1.11 | 0.88 |
| Rectum |  |
1.03 | 1.02 | 1.08 | 1.29 | 1.11 |
| Prostate |  |
1.02 | 1.06 | 1.18 | 0.99 | 1.06 |
Random set-up errors
Individual random error
Individual random error (σindividual) is necessary for calculating population random error (σset-up). It is computed by adding the squares of the differences between each image's mean and setup error. The final total is then divided by the number of images minus one, and the square root of the resulting value must be determined σindividual.
Population random error
The population random error (σset-up) is the mean of all the individual random errors (σ1, σ2, σ3….) and based on equation 5. This equation assumes that the number of images captured each patient is the same or that any variances would have a negligible impact on the final outcome. Table displays the mean population random errors for the seven chosen locations. The average random population errors for the brain, head and neck, breast, lung, bladder, rectum, and prostate were 1.36 mm, 1.54 mm, 3.02 mm, 2.83 mm, 1.81 mm, 1.98 mm, and 2.35 mm, respectively (Table 5).
Tab. 5. The random error population for seven tumour locations
| Treatment Site |
|
Anterior field | lateral field | Average (mm) | ||
|---|---|---|---|---|---|---|
| R-L (mm) | S-I (mm) | S-I (mm) |
A-P (mm) |
|||
| Brain |  |
1.28 | 1.38 | 1.39 | 1.4 | 1.36 |
| Head and neck |  |
1.69 | 1.49 | 1.52 | 1.51 | 1.55 |
| Breast |  |
2.78 | 3.06 | 3.13 | 3.12 | 3.02 |
| Lung |  |
2.93 | 2.89 | 2.76 | 2.72 | 2.83 |
| Bladder |  |
1.6 | 1.91 | 1.87 | 1.84 | 1.81 |
| Rectum |  |
1.95 | 1.93 | 2.06 | 1.98 | 1.98 |
| Prostate |  |
2.3 | 2.42 | 2.31 | 2.37 | 2.35 |
CTV to PTV margin correction
The ratio of CTV to PTV was computed using equation 6. The average values of and for all seven locations are shown in table based on the preceding findings (Tables 1-6).
After applying equation 6 to the data in table 6, the margin needed to be added to the CTV to obtain the PTV for alltreatment locations was computed and shown in (Table 7).
Tab. 6. the average values of ÃÂ?£ and ÃÂ? for all selected seven sites
| Treatment Site | Average (mm) | |
|---|---|---|
| Systematic error (S) | Random error (s) | |
| Brain | 0.7275 | 1.3625 |
| Head and neck | 0.7275 | 1.3625 |
| Breast | 1.2 | 3 |
| Lung | 1.805 | 2.825 |
| Bladder | 0.88 | 1.805 |
| Rectum | 1.105 | 1.98 |
| Prostate | 1.0625 | 2.35 |
Tab. 7. The CTV-to-PTV margin from the patient set-up error component comprises seven tumour locations
| Treatment Site | Margin component from set-up error (mm) |
|---|---|
| Brain | 3 |
| Head and neck | 3.7 |
| Breast | 5.1 |
| Lung | 6.5 |
| Bladder | 3.5 |
| Rectum | 4.1 |
| Prostate | 4.3 |
Discussion
In 2003, the British Institute of Radiology (BIR) published a study that demonstrated in further detail how to determine the PTV margin. The internal and setup margins stated in ICRU Report 6212 were proposed to be replaced by a systematic error margin and a random error margin. The CTV plus the systematic error margin yields the Systematic Target Volume (STV), whereas the random error margin yields the Probabilistic Target Volume (PTV). The contrast between random and systematic errors is also particularly useful in radiotherapy. Systematic errors are the outcome of inefficient treatment design, whereas random errors are the result of ineffective implementation. Due to the fact that some execution faults become less noticeable throughout the course of a treatment, preparation errors often need a greater degree of tolerance than execution problems.
Systematic error is a recurrent, consistent deviation that happens throughout the duration of radiation treatment in the same direction and amount. Systematic errors may occur at any stage of the treatment chain, including localization, planning, and beam delivery. There are several causes for the recurring errors. The following is a summary of these components: 1- target delineation error is the discrepancy between the CTV delineated by the radiation oncologist and the ideal CTV. There are errors in 2-target location and form as a consequence of cancer progression or regression, organ migration, bladder and rectum filling fluctuations, and other factors [13, 14]. 3- data transfer error that happens during picture transmission from the initial localization to the linac through the TPS [15].
The random component is a variable whose am/ount and direction may change depending on the percentage of treatment administered. It persists throughout the treatment administration or implementation phase. The many causes of random errors may be summed up as follows: Variations in the patient's daily posture, treatment equipment, such as immobilization devices, or set-up method between each portion provided might result in unplanned and unanticipated patient set-up errors. Variation in the target's location and form between fractions caused by motion and breathing [16].
Utilizing radiation to treat head-and-neck cancer has vastly improved due to technical breakthroughs such as IMRT and VMAT [17-19]. As a consequence of reduced ambiguity in target delineation and setup errors, the increased dose conformity and delivery of high curative radiation doses to the target with these innovative approaches need more precision in treatment planning and throughout the course of radiotherapy. The most severe mistakes in clinical radiation therapy are often caused to setup and anatomical changes that occur during treatment as a result of tumour shrinking, weight loss, or organ movement [20]. After analysing a total of 420 Cone Beam Computed Tomography (CBCT) images of patients with H and N cancer, found similar results [21]. After online revision, the estimated PTV margins were less than 2.5 mm in all directions. The authors concluded that a 5 mm margin added to CTVs to obtain the respective PTVs was safe for overcoming the problem of setup errors, and under certain circumstances, including reirradiation, close proximity of organs at risk and high-dose regions, or Image-Guided Radiation Therapy (IGRT), these margins can be reduced to 3 mm. Twenty studies have investigated the setup error for breast cancer using CBCT or EPID. Conducted a prospective research to evaluate the accuracy and uniformity of the tangential breast irradiation method [22]. This research found that changes in tangential breast treatment setup from day to day were acceptable and within the stipulated 5 millimetre range. EPID's ability to identify setup variations in patient placement offers several benefits [23]. In their investigation of setup errors with helical. found that the average random shift for all patients was 2.75 millimetres in the lateral direction, 3.15 millimetres in the longitudinal direction, and 3.25 millimetres in the vertical direction [24]. Average absolute displacement was six millimetres. Our study's findings regarding setup errors were comparable to those of previously published research. According to our research, the CTV-to-PTV margin for breast cancer is 5 mm, 1 mm.
Gross Tumour Volume (GTV) delineation differs significantly amongst observers, according to a research on radiation treatment for lung cancer. IGRT may examine the location of the tumour and/or OAR at the time of therapy administration, allowing for additional measurements to enhance or validate the treatment's precision [25]. However, IGRT for lung cancer offers a few unique obstacles. Imaging in two dimensions may make lung cancer identification more challenging. Lung malignancies may spread considerably by breathing and other causes (baseline motion) [26].
During therapy, both external (weight loss) and internal structural changes, such as tumour formation or the shrinkage and re-inflation of the lungs, are common. Lung tumours have the capacity to spread independently of bone structure. To precisely administer radiation to a tumour, volumetric imaging or a suitable alternative must be used to scan it. The movement of organs during breathing and the cardiac cycle reduces the precision of thoracic irradiation. Several techniques exist for minimising the impact of tumour and/or OAR motion during radiation. Due to the aforementioned factors, the margin needed to be added to the CTV in order to attain the PTV is often substantial when compared to other tumours. According to our research, the ratio of CTV to PTV is 6.5 millimetres.
Uncertainty in the bladder cancer radiation therapy has led to several setup concerns. Due to organ motion, which is mostly induced by bladder filling, 3D volumetric imaging must be performed to detect bladder cancer. This may result in significant alterations to the form and location of the bladder, which may lead to errors in geographical data [27]. Moreover, variations in rectal volume may result in positional changes and distortion. In place of a three-dimensional vector displacement of a constant volume, inter- and intrafraction volume variations may result in morphological alterations [28, 29]. In our investigation, a 3.5-mm buffer was added to the CTV to create the PTV. Several further studies have shown significant bladder volume fluctuations during therapy
Similar to, no temporal pattern was seen in relation to fraction number for bladder volume [30-32]. Bouchra Amaoui et al. assessed the impact of errors made during repeated patient placements on the precision and effectiveness of pelvic cancer radiation [33]. According to their investigation, the systematic error in the R-L direction varied from 1.93 mm to 2.01 mm, in the S-I direction from 1.26 mm to 1.39 mm, and in the A-P direction from 1.20 mm to 2.94 mm. Random error ranged from 2.33 mm to 2.90 mm, 1.25 mm to 1.66 mm, and 1.04 mm to 1.28 mm. Using the Van Herk equation, the PTV margin in the R-L, S-I, and A-P directions for the rectum were calculated to be 6.47 mm, 4.03 mm, and 3.70 mm, respectively (equation 6). In addition, the estimated mean error for the rectum in their research was around 0.39 cm in each of the three orientations, which is comparable to our findings. Using the formalism of, the total mean error (M), systematic error (∑), and random error(σ) for the rectum were calculated to be 6.47 mm, 4.03 mm, and 3.70 mm for the R-L, S-I, and A-P dimensions, respectively. Our study indicates that the CTV-toPTV margin is 4.1 mm [34].
The location of the prostate gland is dictated by the physiological movement of the rectum and bladder [35]. The pelvic skeletal structure is not a reliable indication of the location of the prostate gland [36]. Failing to account for changes in prostate location may undermine the biochemical control rate and increase the toxicity of the treatment to normal tissue [37, 38]. We estimate that the distance between the CTV and PTV is 4.3 mm. According, the prostate PTV margins owing to setup error measure 4.4 mm in the R-L direction, 5.9 mm in the S-I direction, and 6.6 mm in the A-P direction. This contrasts with previous research that employed the Exac-Trac technique to determine prostate cancer set-up uncertainty and margins. Identified a margin range of 4.4 mm6.6 mm in their research [39].
Conclusion
The setup error verification data for 210 patients were collected and analysed to identify the systematic and random errors, as well as the CTV to PTV margin. For brain tumours, the margin between CTV and PTV was 3 mm. This small number is due to many variables, including the absence of internal movement in the brain region and the use of a device to immobilise the patient's head, which inhibits head movement during treatment. The CTV-to-PTV margin for head and neck cancers was 3.7 mm. In that there is no internal movement and the opportunity to use an immobilisation device to immobilise the treated area during radiation administration, head and neck sites are almost comparable to brain sites. In contrast to brain and head and neck malignancies, breast tumours are located in a region of the body where internal movement is significant owing to lung movements. CTV to PTV margins in breast cancer patients measured 5.1 mm. The CTV to PTV margin for lung tumours was 6.5 mm because to the substantial tumour migration distance inside the lungs. This margin is regarded to be huge in comparison to the margins of other tumours due to the significant lung movement. The bladder target setting error is high for bladder tumours because to the variability in bladder volume produced by bladder filling. By examining 30 patients with bladder cancer and evaluating the difference in distance between the centre of the radiation fields during treatment and the reference, it was discovered that the difference is between 0-7 mm and that the CTV to PTV margin is 3.5 mm. There is inconsistency among rectum patients due to rectum filling. The content volume of the rectum influences its size and shape. In a study of 30 rectum patients, the CTV to PTV margin was 4.1 mm. Due to variations in the bladder and rectum, the prostate varies in size and shape (location). The CTV to PTV margin was 4.3 mm.
References
- Suit H. The Gray Lecture 2001: coming technical advances in radiation oncology. Int J Radiat Oncol Biol Phys. 2002;53:798-809.
- Dawson LA, Jaffray DA. Advances in image-guided radiation therapy. J clin oncol. 2007;25:938-946.
- Thwaites DI, Malicki J. Physics and technology in ESTRO and in radiotherapy and oncology: past, present and into the 4th dimension. Radiother Oncol. 2011;100:327-332.
- Jain P, Marchant T, Green M, Watkins G, Davies J, et al. Inter-fraction motion and dosimetric consequences during breast intensity-modulated radiotherapy (IMRT). Radiother oncol. 2009;90:93-98.
- Donaldson SL. The Royal College of Radiologists, Society and College of Radiographers.
- Bel A, van Herk M, Lebesque JV. Target margins for random geometrical treatment uncertainties in conformal radiotherapy. Med phys. 1996;23:1537-1545.
- Xu F, Wang J, Bai S, Li Y, Shen Y, et al. Detection of intrafractional tumour position error in radiotherapy utilizing cone beam computed tomography. Radiother Oncol. 2008;89:311-319.
- Sarkar B, Ganesh T, Munshi A, Manikandan A, Roy S, et al. Rotational positional error-corrected linear set-up margin calculation technique for lung stereotactic body radiotherapy in a dual imaging environment of 4-D cone beam CT and ExacTrac stereoscopic imaging. La radiologia medica. 2021;126:979-988.
- Mangar SA, Miller NR, Khoo VS, Hansen V, McNair H, et al. Evaluating inter-fractional changes in volume and position during bladder radiotherapy and the effect of volume limitation as a method of reducing the internal margin of the planning target volume. Clin Oncol.2008;20:698-704.
- Yee D, Parliament M, Rathee S, Ghosh S, Ko L, et al. Cone beam CT imaging analysis of interfractional variations in bladder volume and position during radiotherapy for bladder cancer. Int J Radiat Oncol Biol Phys. 2010;76:1045-1053.
- McGarry CK, Cosgrove VP, Fleming VA, O'SULLIVAN JM, Hounsell AR. An analysis of geometric uncertainty calculations for prostate radiotherapy in clinical practice. Br j radiol. 2009;82:140-147.
- Grégoire V, Mackie TR. State of the art on dose prescription, reporting and recording in Intensity-Modulated Radiation Therapy. Cancer/Radiothér. 2011;15:555-559.
- Van Herk M. Errors and margins in radiotherapy. InSeminars radiat oncol. 2004.
- Radiotherapy TS. The Royal College of Radiologists, Society and College of Radiographers.
- Sarkar V, Paxton A, Kunz J, Szegedi M, Nelson G, et al. A systematic evaluation of the error detection abilities of a new diode transmission detector. J Appl Clin Med Phys. 2019:122-132.
- Gupta T, Chopra S, Kadam A, Agarwal JP, Devi PR, et al. Assessment of three-dimensional set-up errors in conventional head and neck radiotherapy using electronic portal imaging device. Radiat Oncol. 2007;2:1-8.
- Bucci MK, Bevan A, Roach III M. Advances in radiation therapy: conventional to 3D, to IMRT, to 4D, and beyond. CA: a cancer journal for clinicians. 2005;55:117-134.
- Forastiere AA, Zhang Q, Weber RS, Maor MH, Goepfert H, et al. Long-term results of RTOG 91-11: a comparison of three nonsurgical treatment strategies to preserve the larynx in patients with locally advanced larynx cancer. J clin oncol. 2013;31:845.
- Lee N, Xia P, Fischbein NJ, Akazawa P, Akazawa C, et al. Intensity-modulated radiation therapy for head-and-neck cancer: the UCSF experience focusing on target volume delineation. Int J Radiat Oncol Biol Phys. 2003;57:49-60.
- Delishaj D, Ursino S, Pasqualetti F, Matteucci F, Cristaudo A, et al. Set-up errors in head and neck cancer treated with IMRT technique assessed by cone-beam computed tomography: a feasible protocol. Radiat Oncol j. 2018;36:54.
- Dionisi F, Palazzi MF, Bracco F, Brambilla MG, Carbonini C, et al. Set-up errors and planning target volume margins in head and neck cancer radiotherapy: a clinical study of image guidance with on-line cone-beam computed tomography. Int j clin oncol. 2013;18:418-427.
- Lirette A, Pouliot J, Aubin M, Larochelle M. The role of electronic portal imaging in tangential breast irradiation: a prospective study. Radiother Oncol. 1995;37:241-245.
- Chung MJ, Lee GJ, Suh YJ, Lee HC, Lee SW, et al. Setup error and effectiveness of weekly image-guided radiation therapy of TomoDirect for early breast cancer. Cancer Res Treat: Off J Korean Cancer Assoc. 2015;47:774-780.
- Offerman S, Lamba M, Lavigne R. Effect of breast volume on treatment reproducibility on a tomotherapy unit in the treatment of breast cancer. Int J Radiat Oncol Biol Phys. 2011;80:417-421.
- Steenbakkers RJ, Duppen JC, Fitton I, Deurloo KE, Zijp L, et al. Observer variation in target volume delineation of lung cancer related to radiation oncologist–computer interaction: a ‘Big Brother’evaluation. Radiother Oncol. 2005;77:182-190.
- McNair HA, Franks KN, van Herk M. On target 2: updated guidance for image-guided radiotherapy. Clin Oncol. 2022;34:187-188.
- Thariat J, Aluwini S, Pan Q, Caullery M, Marcy PY, et al. Image-guided radiation therapy for muscle-invasive bladder cancer. Nat Rev Urol. 2012;9:23-29.
- Burridge N, Amer A, Marchant T, Sykes J, Stratford J, et al. Online adaptive radiotherapy of the bladder: small bowel irradiated-volume reduction. Int J Radiat Oncol Biol Phys. 2006;66:892-897.
- Mangar SA, Miller NR, Khoo VS, Hansen V, McNair H, Horwich A. Evaluating inter-fractional changes in volume and position during bladder radiotherapy and the effect of volume limitation as a method of reducing the internal margin of the planning target volume. Clinical Oncology. 2008;20:698-704.
- Turner SL, Swindell R, Bowl N, Marrs J, Brookes B, Read G. Bladder movement during radiation therapy for bladder cancer: implications for treatment planning. Int j radiat oncol biol phys. 1997;39:355-360.
- Fokdal L, Honoré H, Høyer M, Meldgaard P, Fode K,et al. Impact of changes in bladder and rectal filling volume on organ motion and dose distribution of the bladder in radiotherapy for urinary bladder cancer. Int j radiat oncol biol phys. 2004;59:436-444.
- Meijer GJ, Rasch C, Remeijer P, Lebesque JV. Three-dimensional analysis of delineation errors, setup errors, and organ motion during radiotherapy of bladder cancer. Int j radiat oncol biol phys. 2003;55:1277-1287.
- Amaoui B, Hadaoui A, Mouhssine D, Semghouli S. Evaluation of setup errors in conformal radiotherapy for pelvic tumours: Case of the Regional Center of Oncology, Agadir. Radiat Med Prot. 2020;1:99-102.
- Van Herk M, Remeijer P, Rasch C, Lebesque JV. The probability of correct target dosage: dose-population histograms for deriving treatment margins in radiotherapy. Int J Radiat Oncol Biol Phys. 2000;47:1121-1135.
- Van Herk M, Remeijer P, Rasch C, Lebesque JV. The probability of correct target dosage: dose-population histograms for deriving treatment margins in radiotherapy. Int J Radiat Oncol Biol Phys. 2000;47:1121-1135.
- Schallenkamp JM, Herman MG, Kruse JJ, Pisansky TM. Prostate position relative to pelvic bony anatomy based on intraprostatic gold markers and electronic portal imaging. Int J Radiat Oncol Biol Phys. 2005;63:800-811.
- De Crevoisier R, Tucker SL, Dong L, Mohan R, Cheung R, et al. Increased risk of biochemical and local failure in patients with distended rectum on the planning CT for prostate cancer radiotherapy. Int J Radiat Oncol Biol Phys. 2005;62:965-973.
- De Crevoisier R, Tucker SL, Dong L, Mohan R, Cheung R, et al. Increased risk of biochemical and local failure in patients with distended rectum on the planning CT for prostate cancer radiotherapy. Int J Radiat Oncol Biol Phys. 2005;62:965-973.
- Alonso-Arrizabalaga S, González LB, Ferrando JV, Peidro JP, Torrecilla JL, et al. Prostate planning treatment volume margin calculation based on the ExacTrac X-Ray 6D image-guided system: margins for various clinical implementations. Int J Radiat Oncol Biol Phys. 2007;69:936-943.


